OPEN-SOURCE SCRIPT
Updated Fair value and MOS
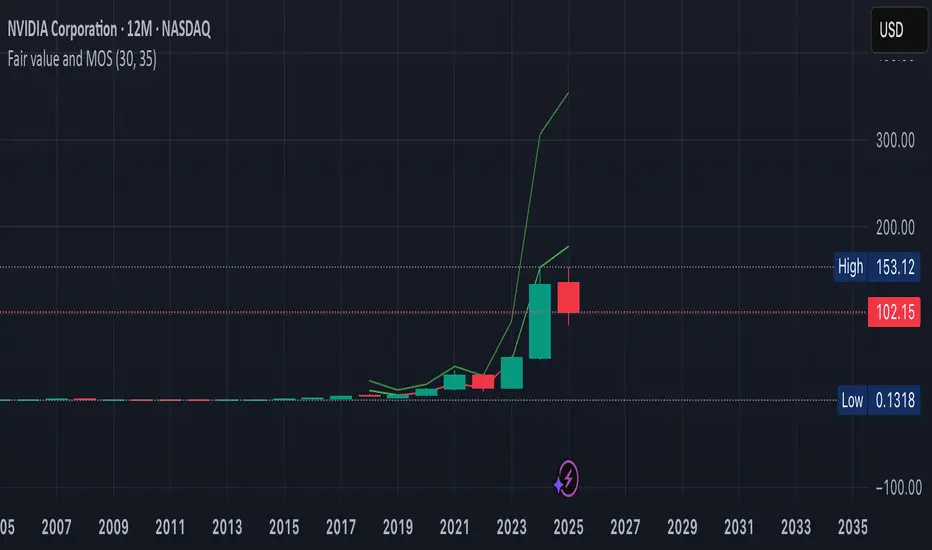
Showing the fair value and margin of safety for a Stock.
Works best with 12 months timeframe.
The calculations are based on historical data for multiple years, up to 10 years.
You will see the following as numbers at the indicator line:
- Forward EPS Growth in %
- Forward PE Calculated
- Forward PE Estimated
The two lines will be shown in green if they are above the current price and in red if the price is bellow the lines.
- The upper line shows the fair value of the stock, calculated with 15% (or 4x in 10 years) expected EPS growth for your investment.
- The lower line shows the margin of safety, calculated at 50% of the fair value.
You can adjust the values at "Forward EPS Growth in %" and "Expected future PE" in order to show your fair price and the price with margin of safety.
Release Notes
Small fixes and refactoring.Release Notes
Show the indicator on all timeframes.The 12 months timeframe will work best because we can calculate the median of the PE and the EPS growth in order to predict the future.
Small refactoring and fixes.
Open-source script
In true TradingView spirit, the creator of this script has made it open-source, so that traders can review and verify its functionality. Kudos to the author! While you can use it for free, remember that republishing the code is subject to our House Rules.
Disclaimer
The information and publications are not meant to be, and do not constitute, financial, investment, trading, or other types of advice or recommendations supplied or endorsed by TradingView. Read more in the Terms of Use.