OPEN-SOURCE SCRIPT
MS Market Timing Model
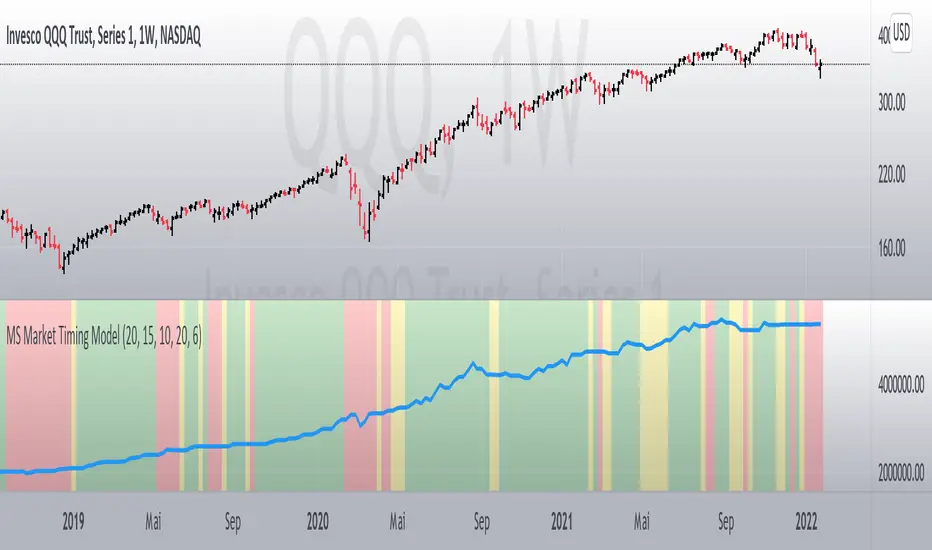
This script uses subtle sentiment analysis to try to reduce the risk of positioning in assets. By "assets" I mean: the QQQ ETF as a synonym for positioning in Nasdaq-100 stocks and the TLT ETF as a placeholder for US government bonds with very long maturity and that as a risk-averse alternative. The coloring of the pseudo capital curve means:
* green = 100% QQQ
* red = 100% TLT
* yellow = 50% QQQ/50% TLT
* green = 100% QQQ
* red = 100% TLT
* yellow = 50% QQQ/50% TLT
Open-source script
In true TradingView spirit, the creator of this script has made it open-source, so that traders can review and verify its functionality. Kudos to the author! While you can use it for free, remember that republishing the code is subject to our House Rules.
Disclaimer
The information and publications are not meant to be, and do not constitute, financial, investment, trading, or other types of advice or recommendations supplied or endorsed by TradingView. Read more in the Terms of Use.