OPEN-SOURCE SCRIPT
Futures/Spot Ratio
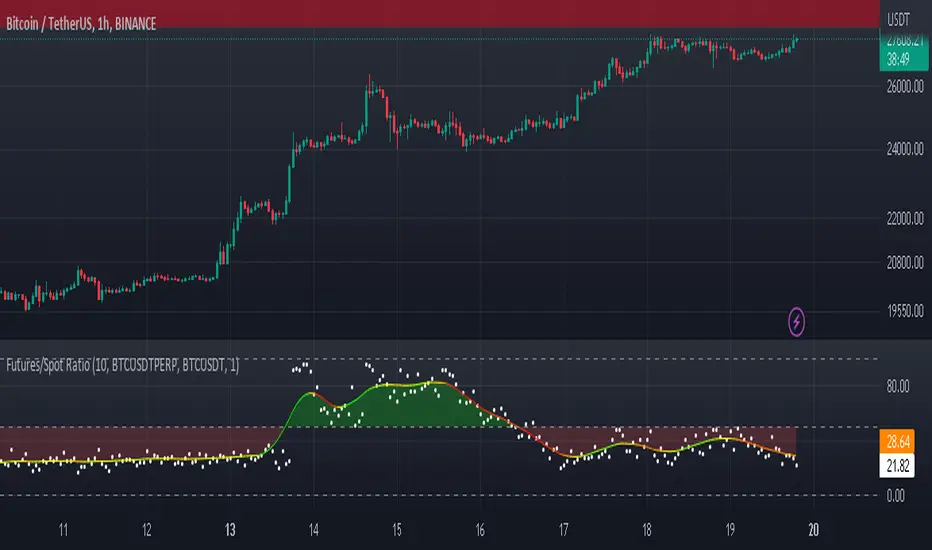
what is Futures /Spot Ratio?
Although futures and spot markets are separate markets, they are correlated. arbitrage bots allow this gap to be closed. But arbitrage bots also have their limits. so there are always slight differences between futures and spot markets. By analyzing these differences, the movements of the players in the market can be interpreted and important information about the price can be obtained. Futures /Spot Ratio is a tool that facilitates this analysis.
what it does?
it compresses the ratio between two selected spot and futures trading pairs between 0 and 100. its purpose is to facilitate use and interpretation. it also passes a regression (Colorful Regression) through the middle of the data for the same purpose.
about Colorful Regression: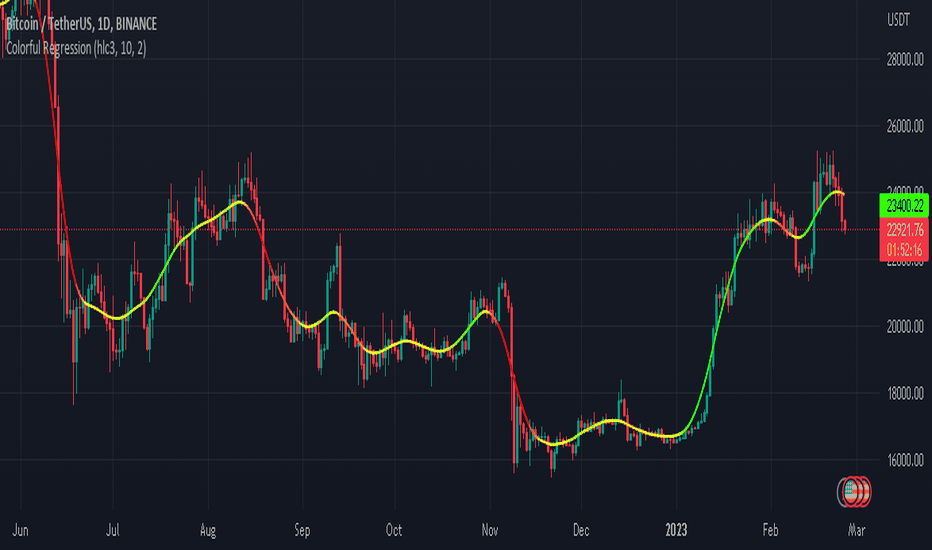
how it does it?
it uses this formula:https://tradingview.sweetlogin.com/x/WqSkZNFL
how to use it?
use it to understand whether the market is priced with spot trades or leveraged positions. A value of 50 is the breakeven point where the ratio of the spot and leveraged markets are equal. Values above 50 indicate excess of long positions in the market, values below 50 indicate excess of short positions. I have explained how to interpret these ratios with examples below.
https://tradingview.sweetlogin.com/x/McLzvEAW
https://tradingview.sweetlogin.com/x/SKhFJ6cp
https://tradingview.sweetlogin.com/x/197T13M3
https://tradingview.sweetlogin.com/x/YXDIKUh1
Open-source script
In true TradingView spirit, the creator of this script has made it open-source, so that traders can review and verify its functionality. Kudos to the author! While you can use it for free, remember that republishing the code is subject to our House Rules.
Disclaimer
The information and publications are not meant to be, and do not constitute, financial, investment, trading, or other types of advice or recommendations supplied or endorsed by TradingView. Read more in the Terms of Use.