OPEN-SOURCE SCRIPT
Average Price in Time Periods
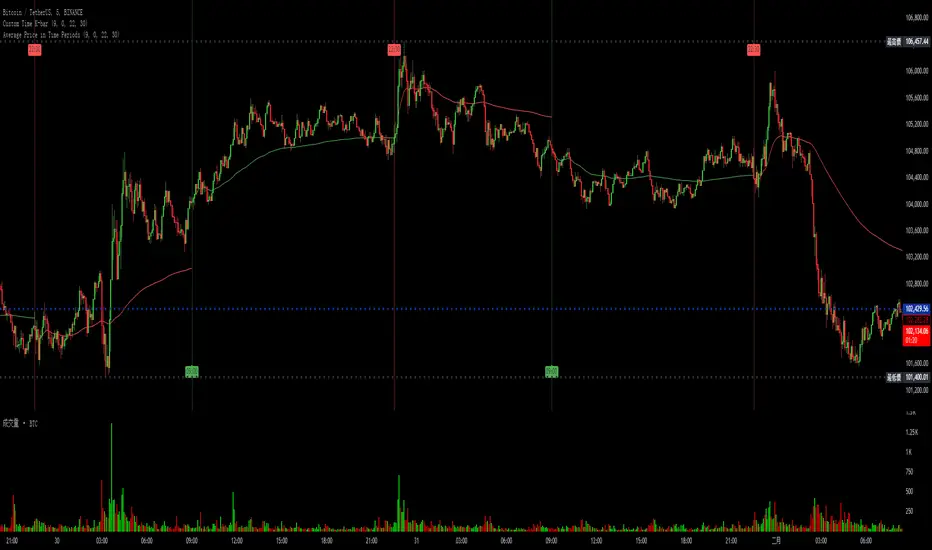
This Pine Script calculates and displays average prices for two specific time ranges during a trading day: from 09:00 to 22:30 and from 22:30 to 09:00. It updates the average prices by summing the closing prices in each time frame and then plots them as green and red lines, respectively. The script also displays black lines outside these specific time ranges to prevent "gaps" in the chart during off-peak hours. The displayed lines are dynamically adjusted based on the current time, with the green line for 09:00-22:30 and the red line for 22:30-09:00.
Open-source script
In true TradingView spirit, the creator of this script has made it open-source, so that traders can review and verify its functionality. Kudos to the author! While you can use it for free, remember that republishing the code is subject to our House Rules.
Disclaimer
The information and publications are not meant to be, and do not constitute, financial, investment, trading, or other types of advice or recommendations supplied or endorsed by TradingView. Read more in the Terms of Use.