OPEN-SOURCE SCRIPT
BAS Enhanced
BAS Enhanced Indicator – A Powerful Market Trend & Volatility Tool
The BAS Enhanced Indicator is a cutting-edge trading tool designed to help traders analyze market trends, volatility, and price momentum with precision. This indicator builds upon traditional Bollinger Bands concepts, integrating adaptive price action tracking, dynamic band width analysis, and advanced smoothing techniques to generate clear and actionable trading insights.
🔹 Key Features & Benefits:
✅ Smart Price Selection – Choose between Close, High, Low, HL2, or HLC3 to tailor the indicator to different market conditions.
✅ Dynamic Band Analysis – Measures price movements relative to dynamically calculated upper and lower bands for real-time market assessment.
✅ Volatility & Trend Strength Measurement – The indicator uses a unique Width Calculation (wd) to gauge market volatility, helping traders understand the strength of price movements.
✅ Composite Indicator Calculation – Combines price position and band width with customizable power functions to provide a more refined momentum signal.
✅ Smoothing for Accuracy – Uses Exponential Moving Average (EMA) and Simple Moving Average (SMA) for a clearer trend visualization, reducing noise in volatile markets.
✅ Two Signal Lines for Confirmation – Includes customizable bullish and bearish signal lines, allowing traders to identify breakouts and reversals with greater confidence.
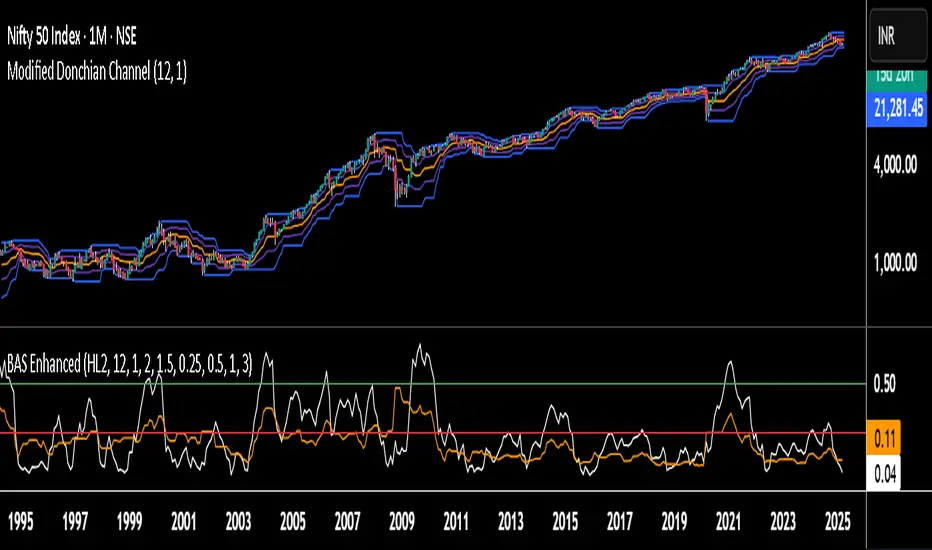
✅ Visual & Alert-Based Trading Signals – The indicator plots:
Smoothed Composite Indicator (Blue Line) – Tracks market momentum
%D Moving Average (Red Line) – A secondary smoothing layer for trend confirmation
Mid Values (Orange & Purple Lines) – Additional volatility references
Signal Lines (Green & Red Horizontal Lines) – Key breakout levels
✅ Built-in Alerts for Trade Signals – Get notified instantly when:
Bullish Alert 🚀 – The indicator crosses above the upper signal line
Bearish Alert 📉 – The indicator crosses below the lower signal line
📈 How to Use the BAS Enhanced Indicator?
🔹 Trend Trading: Use crossovers above Signal Line 2 as a potential buy signal and crossovers below Signal Line 1 as a potential sell signal.
🔹 Volatility Monitoring: When the band width (wd) expands, market volatility is increasing – ideal for breakout traders. When wd contracts, market volatility is low, signaling potential consolidation.
🔹 Momentum Confirmation: Use the %D Moving Average to confirm sustained trend movements before entering a trade.
🚀 Why Use BAS Enhanced?
This indicator is perfect for day traders, swing traders, and trend-followers looking to enhance their market timing, filter false signals, and improve decision-making. Whether you're trading stocks, forex, or crypto, BAS Enhanced helps you stay ahead of market movements with precision and clarity.
🔔 Add BAS Enhanced to your TradingView toolkit today and trade smarter with confidence!
The BAS Enhanced Indicator is a cutting-edge trading tool designed to help traders analyze market trends, volatility, and price momentum with precision. This indicator builds upon traditional Bollinger Bands concepts, integrating adaptive price action tracking, dynamic band width analysis, and advanced smoothing techniques to generate clear and actionable trading insights.
🔹 Key Features & Benefits:
✅ Smart Price Selection – Choose between Close, High, Low, HL2, or HLC3 to tailor the indicator to different market conditions.
✅ Dynamic Band Analysis – Measures price movements relative to dynamically calculated upper and lower bands for real-time market assessment.
✅ Volatility & Trend Strength Measurement – The indicator uses a unique Width Calculation (wd) to gauge market volatility, helping traders understand the strength of price movements.
✅ Composite Indicator Calculation – Combines price position and band width with customizable power functions to provide a more refined momentum signal.
✅ Smoothing for Accuracy – Uses Exponential Moving Average (EMA) and Simple Moving Average (SMA) for a clearer trend visualization, reducing noise in volatile markets.
✅ Two Signal Lines for Confirmation – Includes customizable bullish and bearish signal lines, allowing traders to identify breakouts and reversals with greater confidence.
✅ Visual & Alert-Based Trading Signals – The indicator plots:
Smoothed Composite Indicator (Blue Line) – Tracks market momentum
%D Moving Average (Red Line) – A secondary smoothing layer for trend confirmation
Mid Values (Orange & Purple Lines) – Additional volatility references
Signal Lines (Green & Red Horizontal Lines) – Key breakout levels
✅ Built-in Alerts for Trade Signals – Get notified instantly when:
Bullish Alert 🚀 – The indicator crosses above the upper signal line
Bearish Alert 📉 – The indicator crosses below the lower signal line
📈 How to Use the BAS Enhanced Indicator?
🔹 Trend Trading: Use crossovers above Signal Line 2 as a potential buy signal and crossovers below Signal Line 1 as a potential sell signal.
🔹 Volatility Monitoring: When the band width (wd) expands, market volatility is increasing – ideal for breakout traders. When wd contracts, market volatility is low, signaling potential consolidation.
🔹 Momentum Confirmation: Use the %D Moving Average to confirm sustained trend movements before entering a trade.
🚀 Why Use BAS Enhanced?
This indicator is perfect for day traders, swing traders, and trend-followers looking to enhance their market timing, filter false signals, and improve decision-making. Whether you're trading stocks, forex, or crypto, BAS Enhanced helps you stay ahead of market movements with precision and clarity.
🔔 Add BAS Enhanced to your TradingView toolkit today and trade smarter with confidence!
Open-source script
In true TradingView spirit, the creator of this script has made it open-source, so that traders can review and verify its functionality. Kudos to the author! While you can use it for free, remember that republishing the code is subject to our House Rules.
Disclaimer
The information and publications are not meant to be, and do not constitute, financial, investment, trading, or other types of advice or recommendations supplied or endorsed by TradingView. Read more in the Terms of Use.