OPEN-SOURCE SCRIPT
Horizontal ATR Lines
Disclaimer:
This script was generated using OpenAI’s ChatGPT. I take no responsibility for the correctness, performance, or financial impact of this indicator. Use it at your own risk and discretion.
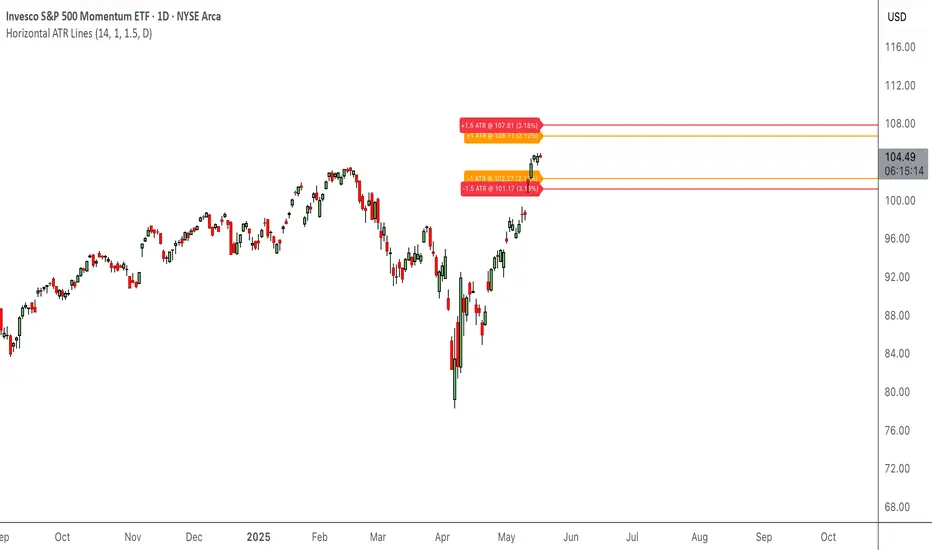
This indicator draws horizontal ATR-based levels from the last closed candle on a user-selected timeframe. It is designed for traders who want to visualize realistic volatility zones for setting dynamic support/resistance, take-profit, or stop-loss levels.
What it does:
Calculates the Average True Range (ATR) using a customizable period and timeframe.
Plots four horizontal lines:
+1 ATR and –1 ATR from the last closed candle’s close
+X ATR and –X ATR, where X is a second custom multiplier
Each level includes a compact label showing:
The price of the level
The percentage distance from the close price
Use cases:
Identify realistic intraday or swing price movement boundaries
Build volatility-aware take-profit and stop-loss zones
Visually track market compression or expansion in context
Customization:
ATR period and timeframe
Two independent ATR multipliers
Custom color settings for each group of levels
This script was generated using OpenAI’s ChatGPT. I take no responsibility for the correctness, performance, or financial impact of this indicator. Use it at your own risk and discretion.
This indicator draws horizontal ATR-based levels from the last closed candle on a user-selected timeframe. It is designed for traders who want to visualize realistic volatility zones for setting dynamic support/resistance, take-profit, or stop-loss levels.
What it does:
Calculates the Average True Range (ATR) using a customizable period and timeframe.
Plots four horizontal lines:
+1 ATR and –1 ATR from the last closed candle’s close
+X ATR and –X ATR, where X is a second custom multiplier
Each level includes a compact label showing:
The price of the level
The percentage distance from the close price
Use cases:
Identify realistic intraday or swing price movement boundaries
Build volatility-aware take-profit and stop-loss zones
Visually track market compression or expansion in context
Customization:
ATR period and timeframe
Two independent ATR multipliers
Custom color settings for each group of levels
Open-source script
In true TradingView spirit, the creator of this script has made it open-source, so that traders can review and verify its functionality. Kudos to the author! While you can use it for free, remember that republishing the code is subject to our House Rules.
Disclaimer
The information and publications are not meant to be, and do not constitute, financial, investment, trading, or other types of advice or recommendations supplied or endorsed by TradingView. Read more in the Terms of Use.