OPEN-SOURCE SCRIPT
Donchian Screener
█ OVERVIEW
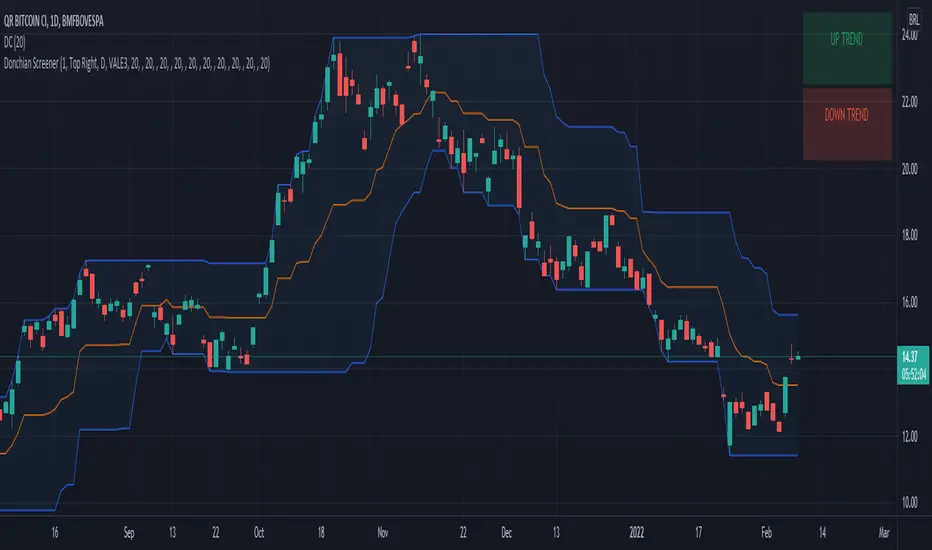
This is a screener script for the Donchian Channel indicator. It's an excellent indicator for trend following, a trading strategy which tries to take advantage of long, medium or short-term moves that seem to play out in various markets.
█ DESCRIPTION
The screener works by scanning through up to 10 symbols and list down symbols that are currently breaking through the upper or lower band as definied by the Donchian Channels, at which point the market signals the start of a bullish or bearish trend.
█ HOW TO USE
After adding the indicator, open the script settings and type the symbol name and length to be used on the Donchian Channels for each stock.
█ PARAMETERS
- Use High/Low Price Breakouts: check this box if you want to use price high/low instead of price close to identify breakouts
- Panel Position: choose whether you want to position the panel on the top, middle or bottom right side of the graph (default is top)
- Default Timeframe: what timeframe to use on the screener (default is daily)
- Ticker: the ticker name you want to monitor
- Length: length parameter used on Donchian Channel indicator
█ FEATURES
The screener can scan up to 10 symbols each time.
█ LIMITATIONS
The screener will scan the symbols breaking out bands on the current bar, and as such, there maybe some delays depending on the stock/ etf /crypto you choose. Some exchanges require an additional subscription to get realtime data.
Open-source script
In true TradingView spirit, the creator of this script has made it open-source, so that traders can review and verify its functionality. Kudos to the author! While you can use it for free, remember that republishing the code is subject to our House Rules.
Disclaimer
The information and publications are not meant to be, and do not constitute, financial, investment, trading, or other types of advice or recommendations supplied or endorsed by TradingView. Read more in the Terms of Use.