OPEN-SOURCE SCRIPT
Custom Zig Zag with Absolute Price Difference
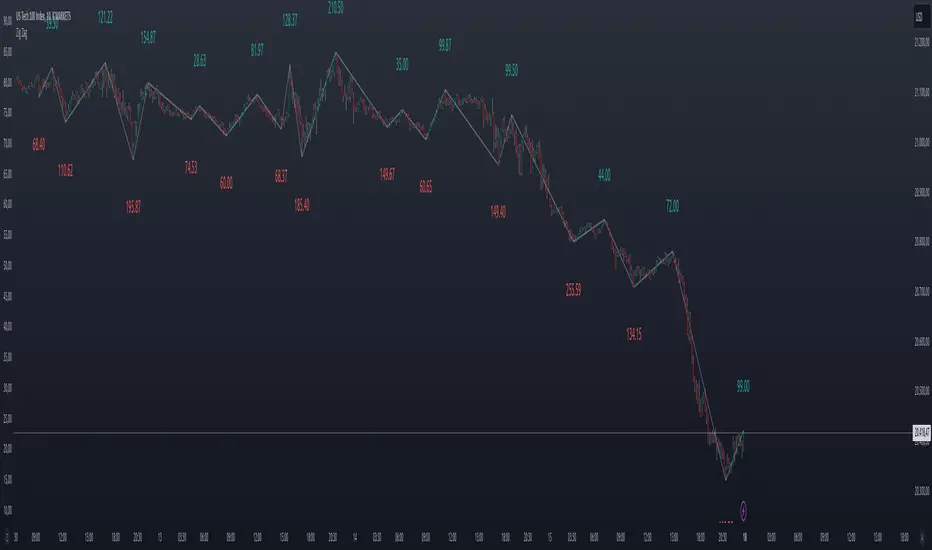
This Zig-Zag indicator visualizes the price movements of a financial instrument and highlights the relevant turning points (pivots) where the price has undergone a significant change. It uses a deviation threshold to mark only substantial movements and ignore minor fluctuations.
The input parameters allow the user to customize the indicator:
Deviation (%): Defines the minimum percentage deviation required to mark a turning point.
Depth: Specifies how many periods before and after a pivot are considered to determine whether it is a real high or low.
Line Color: Allows the user to change the color of the lines that connect the pivots.
Extend to Last Bar: If enabled, extends the last lines to the current bar.
Display Absolute Price Difference: If enabled, the indicator shows the absolute price difference between the current pivot and the previous one.
Label Size: Allows adjusting the font size of the displayed labels.
The logic of the indicator is based on calculating pivots (highs and lows) using price movements. The indicator then tracks the changes between successive pivots and represents them as lines. When the price shows a significant difference from the last pivot (measured in percentage), a line is drawn, and a label displaying the price difference is shown.
Additionally, the indicator uses the calc_dev function to compute the price deviation between the last pivot and the current price. This provides users with a clear visualization of price changes, helping to identify larger price movements.
Open-source script
In true TradingView spirit, the creator of this script has made it open-source, so that traders can review and verify its functionality. Kudos to the author! While you can use it for free, remember that republishing the code is subject to our House Rules.
Disclaimer
The information and publications are not meant to be, and do not constitute, financial, investment, trading, or other types of advice or recommendations supplied or endorsed by TradingView. Read more in the Terms of Use.