OPEN-SOURCE SCRIPT
ICT SMT Divergence Lines - Enhanced
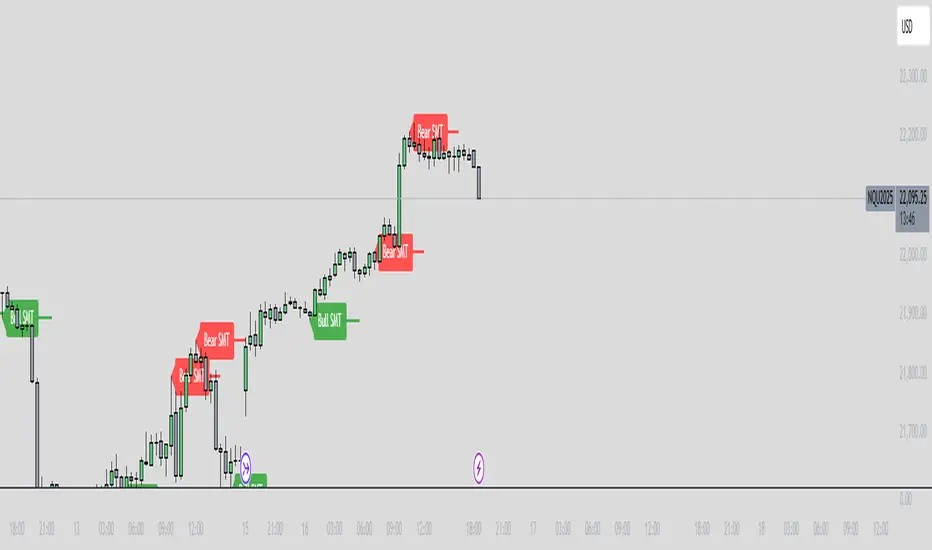
This indicator identifies and highlights Smart Money Technique (SMT) divergence between two user-selected symbols across any timeframe. It compares the last two completed candles of both symbols and marks potential SMT signals only when market context aligns with smart money principles.
⚡ Key Features
✅ SMT Bullish Signal
Symbol 1 forms a lower low compared to its prior candle.
Symbol 2 forms a higher low compared to its prior candle.
The previous candle on the chart was bearish (close < open).
✅ SMT Bearish Signal
Symbol 1 forms a higher high compared to its prior candle.
Symbol 2 forms a lower high compared to its prior candle.
The previous candle on the chart was bullish (close > open).
✅ Visual Representation
Draws a clean, subtle line between the two SMT candles — green for bullish SMT and red for bearish SMT — making divergence easy to spot.
Optional small triangle markers above or below the bar where SMT is detected.
Old lines are automatically removed to keep the chart uncluttered.
✅ Multi-timeframe compatible
Works on any chart timeframe.
Compares the last two completed candles in the current chart timeframe, or can be adapted for a fixed higher timeframe.
Open-source script
In true TradingView spirit, the creator of this script has made it open-source, so that traders can review and verify its functionality. Kudos to the author! While you can use it for free, remember that republishing the code is subject to our House Rules.
Disclaimer
The information and publications are not meant to be, and do not constitute, financial, investment, trading, or other types of advice or recommendations supplied or endorsed by TradingView. Read more in the Terms of Use.