OPEN-SOURCE SCRIPT
ccid (with high low histogram)
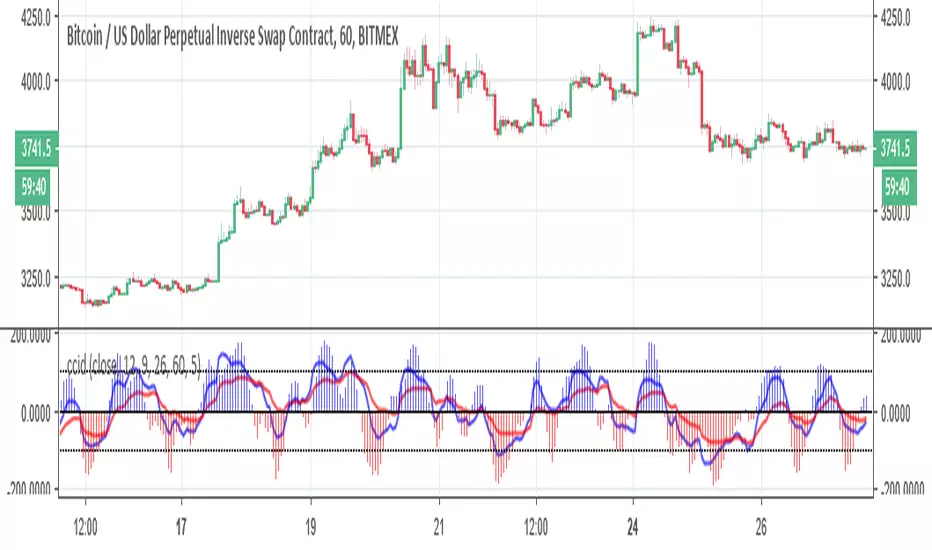
So this indicator has the following : CCI where the buy and sell signal can be either cross of the fast the slow and vice versa or cross of CCI bellow -50 and cross down CCI +50
the histogram (blue and red) is made by high low like histogram the buy and sell is based on crossing of the 0 . since its MTF type . you can toon the TF either to the time frame or use lower graph time with higher TF
since both indicator complement each other then I put them together
the histogram (blue and red) is made by high low like histogram the buy and sell is based on crossing of the 0 . since its MTF type . you can toon the TF either to the time frame or use lower graph time with higher TF
since both indicator complement each other then I put them together
Open-source script
In true TradingView spirit, the creator of this script has made it open-source, so that traders can review and verify its functionality. Kudos to the author! While you can use it for free, remember that republishing the code is subject to our House Rules.
Disclaimer
The information and publications are not meant to be, and do not constitute, financial, investment, trading, or other types of advice or recommendations supplied or endorsed by TradingView. Read more in the Terms of Use.