OPEN-SOURCE SCRIPT
Updated Top - Bottom Using MA
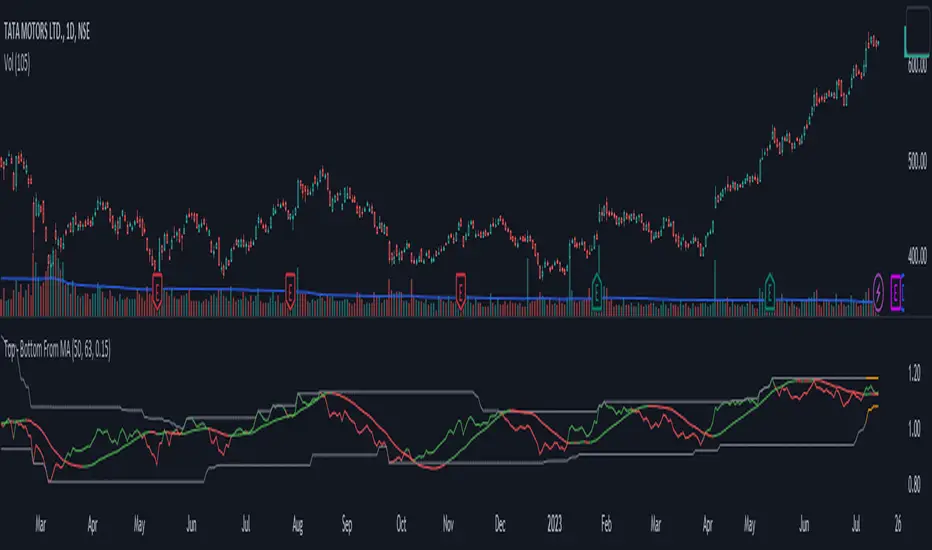
This script is used decide weather stock is overbought or oversold in given length/days from the settings.
using close difference from ohlc4 moving average ratio.
Settings Available
1) moving average length
2) Highest / Lowest ratio length
3) Difference Between Highest and Lowest Line
this script plot/display 4 lines
1) highest difference from moving averages in provided length.
2) lowest difference from moving averages in provided length.
3) ratio of moving average and ohlc4
4) linear regression moving averages of ratio of moving average and ohlc4
How to use this script
1) when ratio line is touch 2 days to highest ratio line means we are consider stock is in overbought levels or linear regression moving average above highest ratio line means overbought.
2) when ratio lines cross below its linear regression moving average then we consider final exit or book profit.
3) when linear regression moving average below lowest ratio line means stock is in oversold.
4) when linear regression moving average below lowest ratio line and linear regression line start rising after fall it means there is change in trend.
5) when linear regression moving average cross above lowest ratio line it means trend is changed and linear regression line turns green.
Release Notes
Added middle line.set default precision to 3 decimal points.
Open-source script
In true TradingView spirit, the creator of this script has made it open-source, so that traders can review and verify its functionality. Kudos to the author! While you can use it for free, remember that republishing the code is subject to our House Rules.
Disclaimer
The information and publications are not meant to be, and do not constitute, financial, investment, trading, or other types of advice or recommendations supplied or endorsed by TradingView. Read more in the Terms of Use.