OPEN-SOURCE SCRIPT
SmartMind2
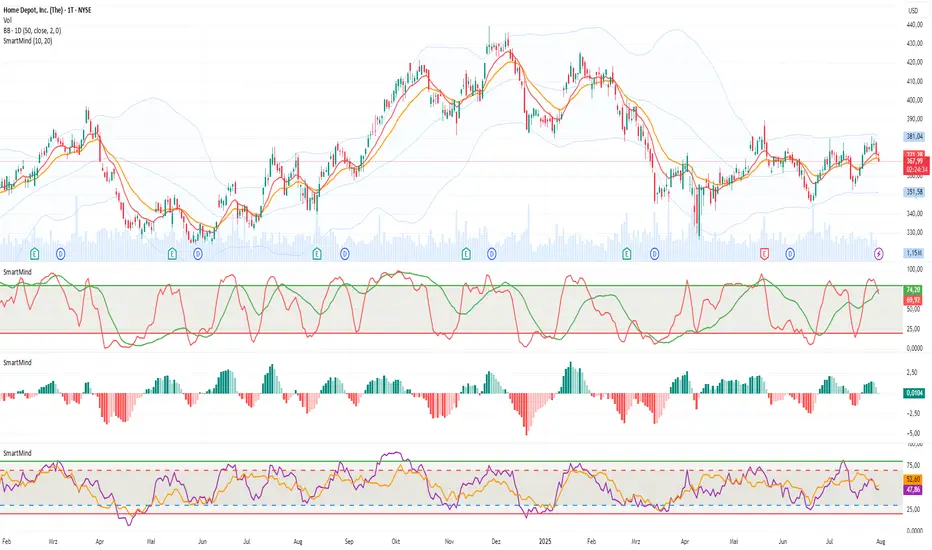
The MACD (Moving Average Convergence Divergence) is a popular technical indicator in trading, primarily used to detect trends and possible reversal points.
How is the MACD structured?
The MACD indicator consists of three components:
MACD Line:
Calculated as the difference between two exponential moving averages (EMAs), commonly 12 and 26 periods.
Formula:
MACD Line
=
𝐸
𝑀
𝐴
12
(
Price
)
−
𝐸
𝑀
𝐴
26
(
Price
)
MACD Line=EMA
12
(Price)−EMA
26
(Price)
Signal Line:
An exponential moving average (usually 9 periods) of the MACD line.
Formula:
Signal Line
=
𝐸
𝑀
𝐴
9
(
MACD Line
)
Signal Line=EMA
9
(MACD Line)
Histogram:
Graphically represents the difference between the MACD line and the Signal line.
Formula:
Histogram
=
MACD Line
−
Signal Line
Histogram=MACD Line−Signal Line
Interpretation of MACD:
Buy Signal: Occurs when the MACD line crosses above the signal line (bullish signal).
Sell Signal: Occurs when the MACD line crosses below the signal line (bearish signal).
Trend Reversal: A divergence between price movements and the MACD indicates a potential reversal (e.g., rising prices with a falling MACD).
Open-source script
In true TradingView spirit, the creator of this script has made it open-source, so that traders can review and verify its functionality. Kudos to the author! While you can use it for free, remember that republishing the code is subject to our House Rules.
Disclaimer
The information and publications are not meant to be, and do not constitute, financial, investment, trading, or other types of advice or recommendations supplied or endorsed by TradingView. Read more in the Terms of Use.