OPEN-SOURCE SCRIPT
Updated RSI + MA, LinReg, ZZ (HH HL LH LL), Div, Ichi, MACD and TSI Hist
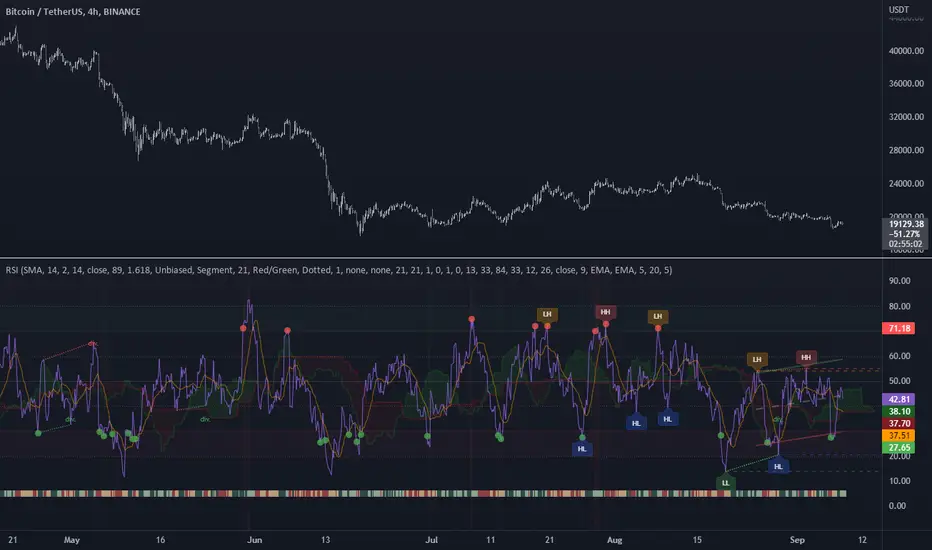
Relative Strength Index with Moving Average, Linear Regression, Zig Zag (Highs and Lows), Divergence, Ichimoku Cloud, Moving Average Convergence Divergence and True Strength Index Histogram
This script is based on zdmre's RSI script, I revamped a lot of things and added a few indicators from ParkF's RSI script.
Disable Labels in the Style tab and the histogram if you don't enlarge the indicator and it seems too small.
Look to buy in the oversold area and bounce of the support of the linear regression.
Look to sell in the overbought area and bounce of the resistance of the linear regression.
Look for retracement to the moving average or horizontal lines, and divergences for potential reversal.
RSI
The Relative Strength Index (RSI) is a well versed momentum based oscillator which is used to measure the speed (velocity) as well as the change (magnitude) of directional price movements.
Moving Average
Moving Average (MA) is a good way to gauge momentum as well as to confirm trends, and define areas of support and resistance.
Linear Regression
The Linear Regression indicator visualizes the general price trend of a specific part of the chart based on the Linear Regression calculation.
Zig Zag (Highs and Lows)
The Zig Zag indicator is used to identify price trends, and in doing so plots points on the chart to mark whenever prices reverse by a larger percentage point than a predetermined variable or marker.
Divergence
The divergence indicator warns traders and technical analysts of changes in a price trend, oftentimes that it is weakening or changing direction.
Ichimoku Cloud
The Ichimoku Cloud is a package of multiple technical indicators that signal support, resistance, market trend, and market momentum.
MACD and TSI Histogram
MACD can be used to identify aspects of a security's overall trend.
The True Strength Index indicator is a momentum oscillator designed to detect, confirm or visualize the strength of a trend.
Release Notes
Added RSI colors (ClassicScott)RSI MA can be disabled and colors changed
Release Notes
Made some changesRelease Notes
Added RSI Trend (traderharikrishna)Release Notes
Added RSI histogramAdded more color customization
Release Notes
Added LSMA and VWAP moving averageAdded Stochastic RSI
Release Notes
Code clean upRelease Notes
Added bars colorsAdded HMA and ALMA moving average
Release Notes
Update, more changesRelease Notes
CleaningRelease Notes
Added RSI background fillRelease Notes
Added possibility to disable only the extended H/L lines while keeping the labelsRelease Notes
Added divergences alerts from zdmre's scriptRelease Notes
Added smoothed RSIAdded color picker for OB/OS dots
Release Notes
Added linear regression lines styleMade some changes
Release Notes
Added RSI candles (Dicargo_Beam)Added background lines colors
Release Notes
Added RSI labelRelease Notes
Added BB reference for RSI line color (change outside the BB)Added BB fill color picker
Fixed smoothed RSI being only applied to the RSI line and RSI histogram
Release Notes
FixRelease Notes
Added full MACD using MACD Scaled by bluesky509Removed TSI histogram
tradingview.sweetlogin.com/proxy-s3/snapshots/x/xJts0POE.png
Release Notes
Added RSI trend state from Koalafied RSI by Koalafied_3Removed RSI trend
Open-source script
In true TradingView spirit, the creator of this script has made it open-source, so that traders can review and verify its functionality. Kudos to the author! While you can use it for free, remember that republishing the code is subject to our House Rules.
Disclaimer
The information and publications are not meant to be, and do not constitute, financial, investment, trading, or other types of advice or recommendations supplied or endorsed by TradingView. Read more in the Terms of Use.