OPEN-SOURCE SCRIPT
RSI normalized by Bollinger Bands
English.
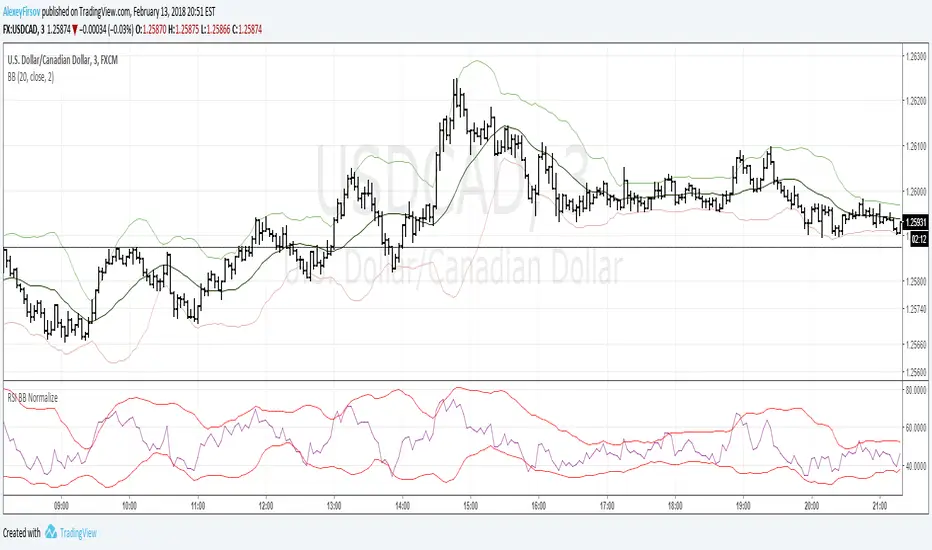
RSI indicator with Bollinger Bands in one. Forgot oversold and overbought!
With BB and RSI you can dinamically saw when RSI is in critical values. And when you can see figure 'M' or 'W' in oscillator it means that current movement of impulse is down.
Русский.
RSI и Ленты Боллинджера в одном. Забудьте о тупых линиях перекупленности и перепроданности!
При работе в связке вы можете определять эти зоны динамически. И при формировании фигуры 'M' или 'W' на осцилляторе будет четко показано, что текущий импульс умер, надо выходить из сделки.
Example of usage (exit points) / Пример использования (точки выхода)
Open-source script
In true TradingView spirit, the creator of this script has made it open-source, so that traders can review and verify its functionality. Kudos to the author! While you can use it for free, remember that republishing the code is subject to our House Rules.
Disclaimer
The information and publications are not meant to be, and do not constitute, financial, investment, trading, or other types of advice or recommendations supplied or endorsed by TradingView. Read more in the Terms of Use.