OPEN-SOURCE SCRIPT
Updated Trend Breakout
Description:
This Pine Script indicator identifies pivot high and pivot low points based on user-defined left and right candle legs, detecting breakouts to signal potential trend changes. It plots horizontal lines at pivot highs (lime) and pivot lows (red), marking breakout signals with labels ("Br") when the price crosses above a pivot high or below a pivot low. The indicator also changes the background color to reflect the trend (green for uptrend, red for downtrend) with adjustable transparency. The indicator primarily focuses on recognizing specific pivot patterns to define trends and generate trading signals.
How It Works
• Pivot Detection: Identifies pivot highs and lows using configurable left (Left side Pivot Candle) and right (Right side Pivot Candle) periods.
• Pivot Highs (PH): A pivot high is identified when a candle's high is greater than a specified number of preceding candles (left leg) and succeeding candles (right leg).
• Pivot Lows (PL): Similarly, a pivot low is identified when a candle's low is less than a specified number of preceding and succeeding candles.
The script then tracks the last three pivot highs and pivot lows.
Trend Detection and Breakouts
1. High Line (Resistance): When a middle pivot high (out of the three tracked) is higher than both the previous and the next pivot high, a lime green line is drawn from that pivot high. This line acts as a dynamic resistance level.
2. Low Line (Support): Conversely, when a middle pivot low is lower than both the previous and the next pivot low, a red line is drawn from that pivot low. This line acts as a dynamic support level.
________________________________________
Trading Signals : The indicator generates signals based on price crossing these dynamically drawn lines .
• Long Signal (Uptrend):
o A "Long" signal is triggered when the close price crosses above the current high line (resistance), and the indicator is not already in an uptrend.
o When a long signal occurs, the background turns green, and the high line becomes dotted and thinner. A "Br" (Breakout) label appears below the candle.
• Short Signal (Downtrend):
o A "Short" signal is triggered when the close price crosses below the current low line (support), and the indicator is not already in a downtrend.
o When a short signal occurs, the background turns red, and the low line becomes dotted and thinner. A "Br" (Breakout) label appears above the candle.
________________________________________
Customizable Settings
The indicator provides three user-adjustable inputs:
• Right Side Pivot Candle (fpivotLeg): This setting (default 10) determines the number of candles to the right that must have lower highs/higher lows for a pivot to be confirmed.
• Left Side Pivot Candle (bpivotLeg): This setting (default 15) determines the number of candles to the left that must have lower highs/higher lows for a pivot to be confirmed.
• Adjust Color Visualization (Colortrnp): This setting (default 85) controls the transparency of the background color changes, allowing you to adjust how prominently the green (uptrend) and red (downtrend) backgrounds are displayed.
________________________________________
How to Use It
This indicator can be used by traders to:
• Identify potential reversals: The formation of new pivot highs and lows can signal shifts in market direction.
• Spot breakout opportunities: Crossing above the high line or below the low line can indicate the start of a new trend or the continuation of an existing one.
• Confirm trend strength: The presence and extension of the high and low lines can provide visual cues about the prevailing trend.
• Ideal for swing traders or trend-following strategies.
• Use the breakout labels ("Br") and background color to confirm trend direction.
• Adjust pivot leg inputs to fine-tune sensitivity for different timeframes or assets.
• Customize transparency to suit chart readability.
Example:
On a breakout above a pivot high, a green "Br" label appears, the background turns green, and the pivot line becomes dotted. This signals a potential uptrend, helping traders identify entry points or trend confirmations.
Disclaimer: No indicator guarantees profits. Always use this indicator in conjunction with other analysis methods and proper risk management.
Release Notes
Title: Trend Breakout [Trend_MyFrend]Short Title: TrendBrk [TMF]
Description:
The Trend Breakout [Trend_MyFrend] indicator is a dynamic tool designed to identify trend breakouts by detecting pivot highs and lows and drawing trendlines to signal price breakouts. It highlights bullish and bearish trends with color-coded trendlines, background shading, and breakout labels, complemented by an info panel displaying the symbol, timeframe, and key levels. With customizable pivot detection and alert options, this indicator is ideal for traders seeking to capture trend reversals and continuations across all stocks and index, forex, crypto, and commodities.
Key Features:
• Pivot-Based Breakout Detection: Identifies significant pivot highs/lows to draw trendlines
and detect breakouts when price crosses these lines.
• Trend Visualization: Uses green (bullish) and red (bearish) trendlines, background colors,
and labels to indicate trend direction and breakout points.
• Info Panel: Displays symbol, timeframe, and current high/low levels in a top-right table.
• Customizable Settings: Adjust pivot lookback, transparency, and toggle alerts or labels for
personalized analysis.
• Alert System: Triggers alerts for long and short breakouts, with optional on-chart markers.
• Real-Time Updates: Trendlines and labels dynamically extend to the current bar, updating
with new pivots.
How It Works:
1. Pivot Detection: Uses ta.pivothigh and ta.pivotlow to identify key swing points based on
user-defined left and right lookback periods.
2. Trendline Drawing: Connects pivot highs (green) and lows (red) to form trendlines, which
shift to dotted lines post-breakout.
3. Breakout Signals: Detects long breakouts (price crosses above high trendline) and short
breakouts (price crosses below low trendline), updating trend state and background color.
4. Visual Output:
o Trendlines: Green for highs, red for lows, with dynamic extension.
o Labels: Breakout markers ("▲ LONG BREAKOUT", "▼ SHORT BREAKOUT") and trend level
labels ("Next Up/Down Trend Levels").
o Background: Green for bullish, red for bearish trends, with adjustable transparency.
o Info Panel: Shows syminfo.ticker, timeframe.period, and high/low levels (format.mintick).
5. Alerts: Configurable alerts for long/short breakouts, with messages including the ticker
symbol.
Settings:
• Right/Left Side Pivot Candle: Set bars for pivot detection (default: 10 right, 20 left).
• Color Transparency: Adjust background transparency (0–90, default: 85).
• Show Info Label: Toggle info panel (default: true).
• Enable Breakout Alerts: Toggle alerts (default: true).
• Show Alert Markers: Display breakout labels on chart (default: true).
Symbol and Timeframe Information:
• Symbol: Displayed via syminfo.ticker in the info panel (e.g., BTCUSD).
• Timeframe: Shown as timeframe.period in the info panel (e.g.,5M,15M, 1H, D).
• Script Name: Trend Breakout [Trend_MyFrend].
Script Information:
• Full Name: Trend Breakout [Trend_MyFrend]
• Short Name: TrendBrk [TMF]
• Pine Script Version: version=6
• Overlay: True (plots directly on the chart)
• Max Bars Back: 4000 (supports historical analysis)
• Max Labels/Lines: 500 each (optimized for performance)
Usage:
1. Apply to any TradingView chart.
2. Adjust pivot settings to fine-tune breakout sensitivity (e.g., shorter lookback for intraday
trading).
3. Monitor trendlines and breakout signals to identify trend reversals or continuations.
4. Combine with volume or momentum indicators for confluence.
5. Suitable for swing trading, day trading, and multi-timeframe strategies across all markets.
Notes:
• Optimized to avoid chart clutter by deleting outdated trendlines and labels.
• Uses distinct colors (green for bullish, red for bearish) for clear trend identification.
• Best on 15M, 1H ,1D charts or higher; adjust pivot settings for lower timeframes.
• Alert messages include ticker for easy integration with TradingView’s alert system.
Example Use Case:
On a 1H ETH/USD chart, the indicator draws a green trendline at a pivot high of $3,500. When price breaks above, a "▲ LONG BREAKOUT" label appears, the background turns green, and an alert triggers. The info panel shows: "Symbol: ETHUSD, Timeframe: 1H, High Level: 3500.00."
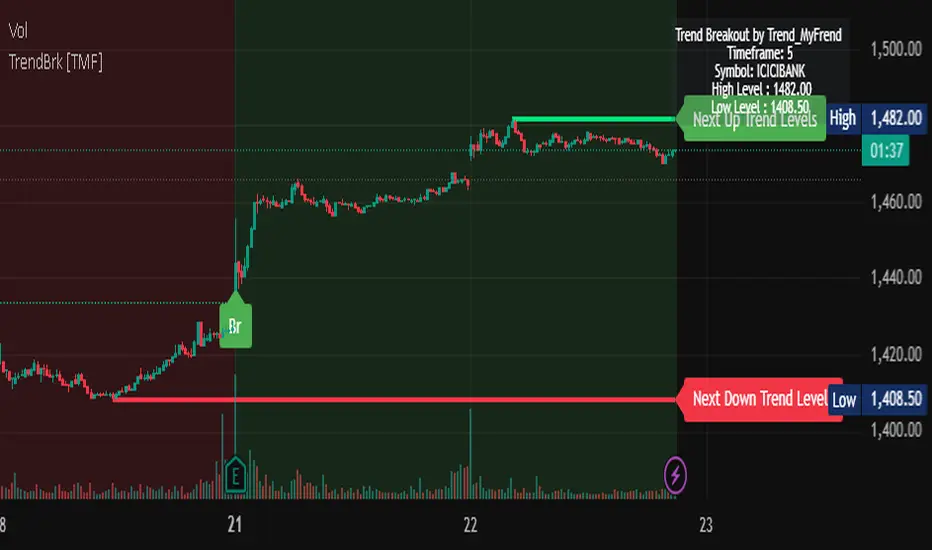
Visual Example:
• High Trendline/Label: Green line with "Next Up Trend Levels" at pivot high.
• Low Trendline/Label: Red line with "Next Down Trend Levels" at pivot low.
• Breakout Labels: "▲ LONG BREAKOUT" (green) or "▼ SHORT BREAKOUT" (red).
• Background: Green (bullish) or red (bearish) with adjustable transparency.
• Info Panel: Top-right table with symbol, timeframe, and high/low levels.
Author: Trend_MyFrend
Version: 1.0
Updated: 22 July 2025
Open-source script
In true TradingView spirit, the creator of this script has made it open-source, so that traders can review and verify its functionality. Kudos to the author! While you can use it for free, remember that republishing the code is subject to our House Rules.
mail Id : satyambeed@gmail.com
WhatsApp +919270007010
Telegram : @AI_Trend_My_Friend forms.gle/H5FUra2tFHn3WR8u6
WhatsApp +919270007010
Telegram : @AI_Trend_My_Friend forms.gle/H5FUra2tFHn3WR8u6
Disclaimer
The information and publications are not meant to be, and do not constitute, financial, investment, trading, or other types of advice or recommendations supplied or endorsed by TradingView. Read more in the Terms of Use.