OPEN-SOURCE SCRIPT
Updated How To Input CSV List Of Symbol Data Used For Screener
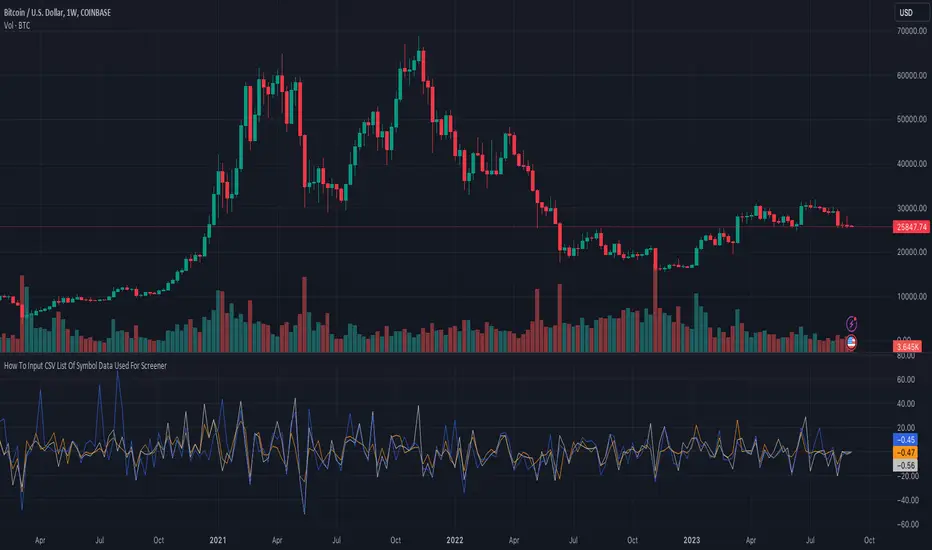
Example of how to input multiple symbols at once using a CSV list of ticker IDs. The input list is extracted into individual ticker IDs which are then each used within an example screener function that calculates their rate of change. The results for each of the rate of changes are then plotted.
For code brevity this example only demonstrates using up to 4 symbols, but the logic is annotated to show how it can easily be expanded for use with up to 40 ticker IDs.
The CSV list used for input may contain spaces or no spaces after each comma separator, but whichever format (space or no space) is used must be used consistently throughout the list. If the list contains any invalid symbols the script will display a red exclamation mark that when clicked will display those invalid symbols.
If more than 4 ticker IDs are input then only the first 4 are used. If less than 4 ticker IDs are used then the unused screener calls will return `float(na)`. In the published chart the input list is using only 3 ticker IDs so there are only 3 plots shown instead of 4.
NOTICE: This is an example script and not meant to be used as an actual strategy. By using this script or any portion thereof, you acknowledge that you have read and understood that this is for research purposes only and I am not responsible for any financial losses you may incur by using this script!
Release Notes
Revision 1• Cosmetic cleanup of comments and code, no logic changes were made.
Open-source script
In true TradingView spirit, the creator of this script has made it open-source, so that traders can review and verify its functionality. Kudos to the author! While you can use it for free, remember that republishing the code is subject to our House Rules.
lux ex tenebris • deuro mea umbra absens • Telegram: t.me/allanster
Disclaimer
The information and publications are not meant to be, and do not constitute, financial, investment, trading, or other types of advice or recommendations supplied or endorsed by TradingView. Read more in the Terms of Use.