OPEN-SOURCE SCRIPT
Daily ADR Table
Daily ADR Table Indicator
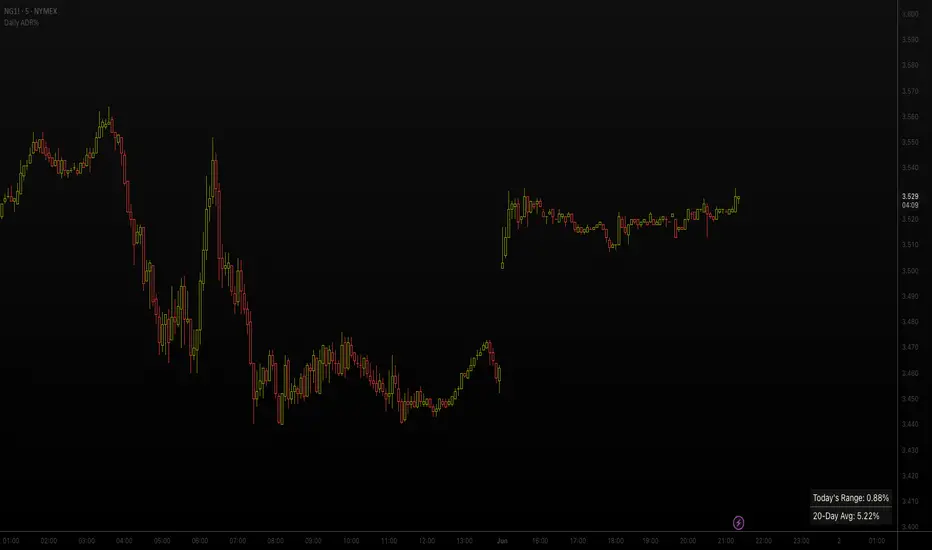
The Daily Average Daily Range (ADR) Table displays real-time volatility statistics directly on your chart. It shows both the current day's range and the historical average daily range as percentages of the current price, providing essential volatility metrics for trading decisions.
The indicator tracks today's range in real-time throughout the trading session using session-based calculations to ensure accuracy. It compares this against a customizable historical average (default 20 days, adjustable from 1-500 days) to help traders assess whether current volatility is above or below normal levels.
All values are displayed as percentages for easy comparison across different price levels and formatted to two decimal places for precision. The table position, text size, alignment, and colors are fully customizable with nine position options and professional default styling optimized for readability.
This indicator is valuable for day traders, swing traders, and market analysts who need to quickly assess current market volatility relative to historical norms. It assists in position sizing decisions, setting stop losses, and identifying potential breakout or consolidation scenarios based on range expansion or contraction.
Open-source script
In true TradingView spirit, the creator of this script has made it open-source, so that traders can review and verify its functionality. Kudos to the author! While you can use it for free, remember that republishing the code is subject to our House Rules.
Wanna buy me a coffee or need a script? Hit me up here: buymeacoffee.com/jvye
Disclaimer
The information and publications are not meant to be, and do not constitute, financial, investment, trading, or other types of advice or recommendations supplied or endorsed by TradingView. Read more in the Terms of Use.