OPEN-SOURCE SCRIPT
Percentage difference to averages
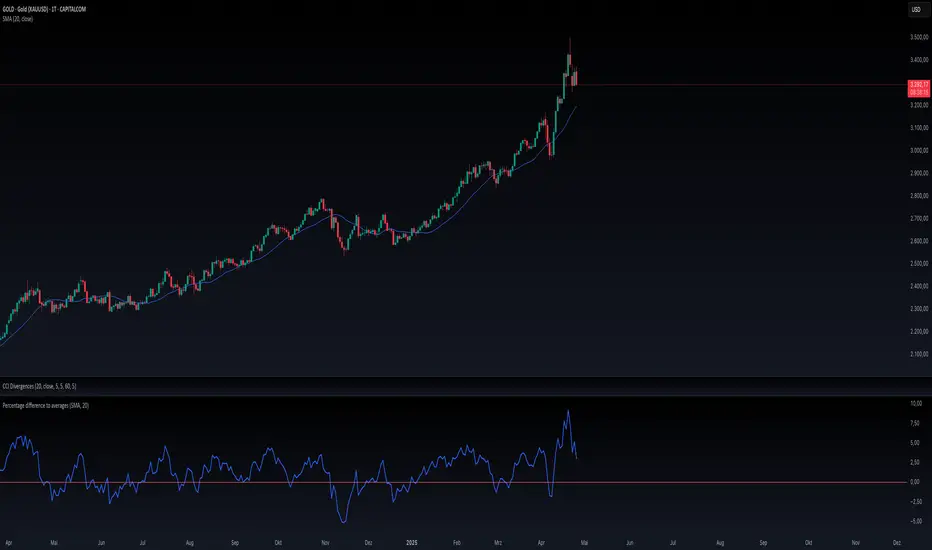
Simple indicator to analyse the distance of price and average.
An indicator that shows the percentage distance between the current price and a moving average (MA) is a powerful tool to assess how far the price has deviated from its recent average. It provides insights into market extremes, momentum, and potential reversal zones.
Identifying Overbought / Oversold Conditions:
When the price is significantly above the moving average (e.g., +10% or more), it might suggest that the asset is overbought and could be due for a correction or consolidation.
If the price is far below the MA (e.g., –10%), it might indicate oversold conditions and a potential rebound.
Gauging Strength or Weakness:
- A large positive distance shows strong bullish momentum – price is surging away from its average.
- A large negative distance can suggest weakness, panic selling, or capitulation.
This helps traders and analysts see whether current price action is strong or potentially stretched.
Entry/Exit Signal Aid
- Trend followers might enter when the price pulls back toward the MA after a strong run.
- Mean reversion traders use the distance to bet on a return toward the average when the deviation gets too extreme.
Open-source script
In true TradingView spirit, the creator of this script has made it open-source, so that traders can review and verify its functionality. Kudos to the author! While you can use it for free, remember that republishing the code is subject to our House Rules.
Disclaimer
The information and publications are not meant to be, and do not constitute, financial, investment, trading, or other types of advice or recommendations supplied or endorsed by TradingView. Read more in the Terms of Use.