OPEN-SOURCE SCRIPT
Updated 52/N Weeks High/Low
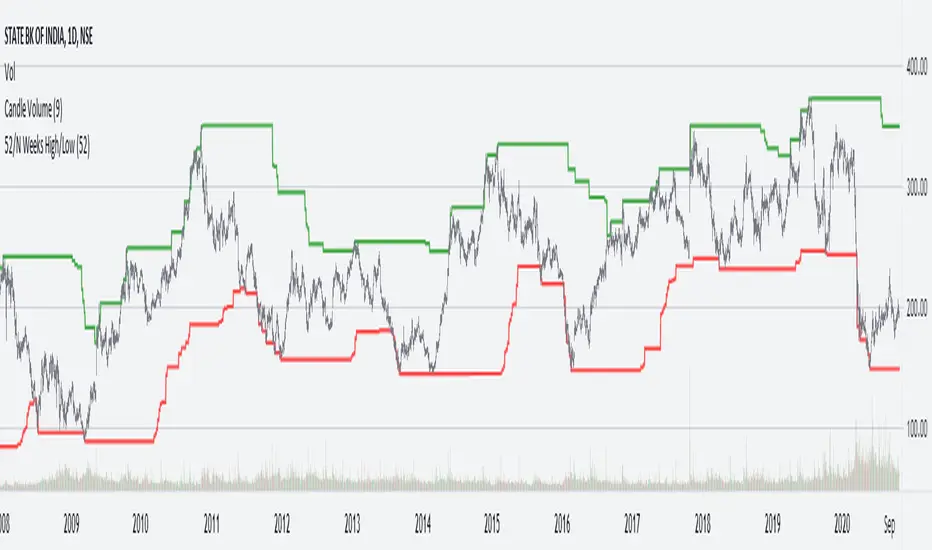
Plots 52 Weeks historical high and low with respect to each bar.
Works on all timeframes - minute, days, weeks, months - and always plots 52 weeks historical high and low.
The 52 weeks lookback window slides backwards as we plot for older / historical bars on the chart.
Instead of 52 weeks, number of weeks to look back can be specified using 'No. of weeks to lookback' parameter in Settings --> Inputs.
Style and color for 'High' and 'Low' plots can be changed through Settings --> Style
Release Notes
Aesthetic changes to setting names and default colorsOpen-source script
In true TradingView spirit, the creator of this script has made it open-source, so that traders can review and verify its functionality. Kudos to the author! While you can use it for free, remember that republishing the code is subject to our House Rules.
Disclaimer
The information and publications are not meant to be, and do not constitute, financial, investment, trading, or other types of advice or recommendations supplied or endorsed by TradingView. Read more in the Terms of Use.
Open-source script
In true TradingView spirit, the creator of this script has made it open-source, so that traders can review and verify its functionality. Kudos to the author! While you can use it for free, remember that republishing the code is subject to our House Rules.
Disclaimer
The information and publications are not meant to be, and do not constitute, financial, investment, trading, or other types of advice or recommendations supplied or endorsed by TradingView. Read more in the Terms of Use.