OPEN-SOURCE SCRIPT
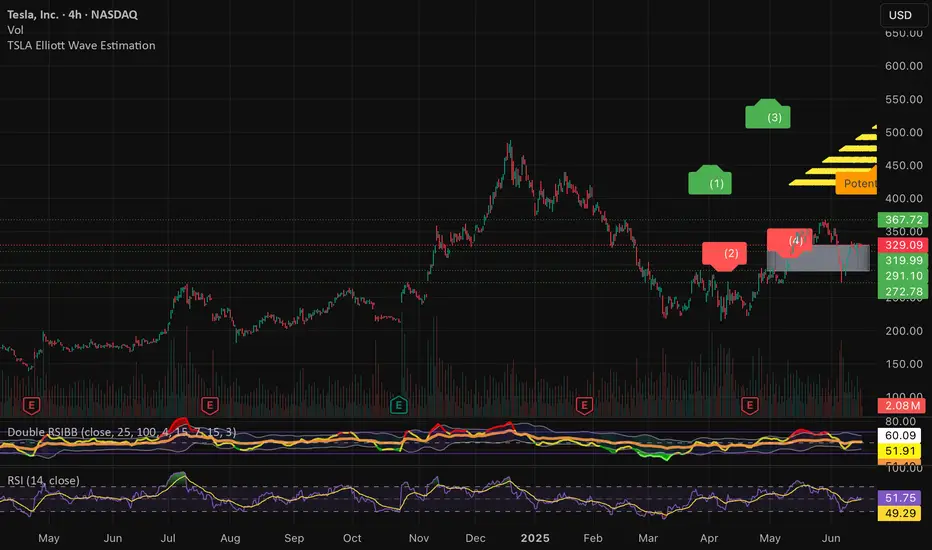
TSLA Elliott Wave Estimation
//version=5
indicator("TSLA Elliott Wave Estimation", overlay=true)
// === PRICE SWINGS LOGIC (simplified manual labeling structure) ===
// Manually approximate major pivot points (this should ideally be semi-automated or confirmed with fractal/zigzag logic)
wave1_top = label.new(x=bar_index[100], y=450, text="(1)", style=label.style_label_up, color=color.green, textcolor=color.white)
wave2_bottom = label.new(x=bar_index[90], y=290, text="(2)", style=label.style_label_down, color=color.red, textcolor=color.white)
wave3_top = label.new(x=bar_index[60], y=550, text="(3)", style=label.style_label_up, color=color.green, textcolor=color.white)
wave4_bottom = label.new(x=bar_index[45], y=310, text="(4)", style=label.style_label_down, color=color.red, textcolor=color.white)
// Forecasted wave 5 zone
wave5_target_top = line.new(x1=bar_index, y1=420, x2=bar_index + 20, y2=450, extend=extend.right, color=color.yellow, width=2, style=line.style_dashed)
label.new(x=bar_index + 20, y=450, text="Potential (5)", style=label.style_label_up, color=color.orange, textcolor=color.black)
// Optional: Visual zone for retracement support
support_box = box.new(left=bar_index - 15, top=330, right=bar_index + 5, bottom=290, border_color=color.gray, bgcolor=color.new(color.gray, 85))
Open-source script
In true TradingView spirit, the creator of this script has made it open-source, so that traders can review and verify its functionality. Kudos to the author! While you can use it for free, remember that republishing the code is subject to our House Rules.
Disclaimer
The information and publications are not meant to be, and do not constitute, financial, investment, trading, or other types of advice or recommendations supplied or endorsed by TradingView. Read more in the Terms of Use.