OPEN-SOURCE SCRIPT
Updated RSI (w/ Curve and Volatility)
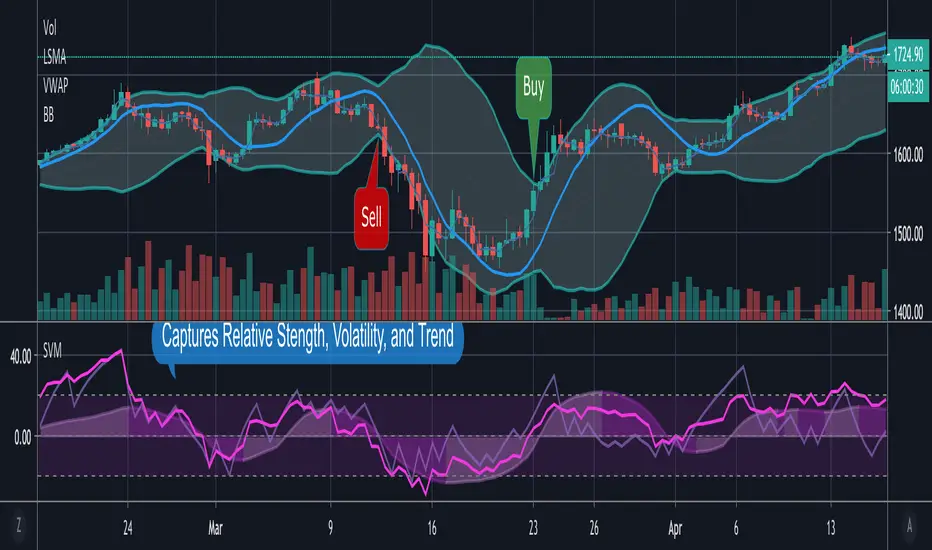
This is a centered triple oscillator which measures RSI, RVI (volatility), and Coppock Curve (trend). This is centered so it ranges from negative 50 to positive 50. This indicator is used most accurately when all 3 indicators show above/below 0.
RSI is the bright pink line. RSI determines strength in a direction. When it is above 20 or below -20, a pullback is likely - this could be a prime time to scale out of position. Remember do not enter a trade just because it is oversold, as the strength is still greatly against you.
RVI is the thin lighter line. RVI was created by Donald Dorsey to use in conjunction with other indicators. The instructions for using RVI is to sell/short when below -10 and buy/cover when above 10. Use this indicator to confirm your bias.
The purple area is the Coppock curve. This curve is used to analyze longer term trends in a chart. RSI and RVI struggle to indicate long term trends, use the Coppock curve to confirm your bias. The curve is bullish when above 0 and bearish when below 0. Be cautious when trying to buy or sell it early when its falling. If it is falling and pops back up without reaching 0, it is typically indicate of a big price movement in that direction.
Release Notes
- Easier to read Volatility- Coppock Curve will brighten when trending upwards
- Coppock Curve is now on a relative scale from -50 - 50
Open-source script
In true TradingView spirit, the creator of this script has made it open-source, so that traders can review and verify its functionality. Kudos to the author! While you can use it for free, remember that republishing the code is subject to our House Rules.
Disclaimer
The information and publications are not meant to be, and do not constitute, financial, investment, trading, or other types of advice or recommendations supplied or endorsed by TradingView. Read more in the Terms of Use.