OPEN-SOURCE SCRIPT
Momentum Oscillator Modified
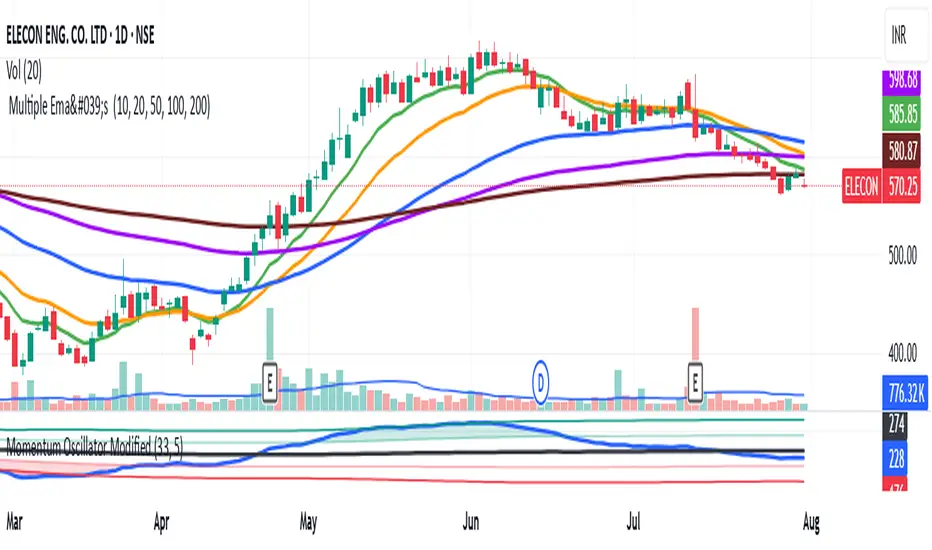
This indicator is a custom momentum oscillator enhanced with True Range-adjusted price logic and dynamic Bollinger Bands, offering a refined way to track price strength, momentum shifts, and overbought/oversold extremes with reduced noise.
Key Features:
Dynamic Price Oscillator:
Measures momentum using both price change and a volatility-adjusted price for greater accuracy.
Smoothing factor lets you fine-tune the balance between responsiveness and noise filtering.
True Range-Based Volatility Adjustment:
Integrates true range calculations to adapt to current volatility, making signals more robust during different market conditions.
Adaptive Bollinger Bands:
Two sets of custom Bollinger Bands (standard and expanded) are drawn around the oscillator, adapting over time.
These bands help identify when momentum is exceptionally strong or weak relative to recent history.
Special fills dynamically highlight when the oscillator breaks above/below the bands, signaling potential trend extremes.
Customization:
Easily adjust lookback length and smoothing factor to fit your personal trading style (e.g., scalping or swing trading).
How to Use:
Watch for the oscillator crossing above the green Bollinger Bands or below the red bands for potential overbought/oversold or breakout scenarios.
Expanded bands provide a "super extreme" zone which may hint at exhaustion or trend climax.
The dynamic mean (black line) gives a visual reference for the normalized momentum level.
Open-source script
In true TradingView spirit, the creator of this script has made it open-source, so that traders can review and verify its functionality. Kudos to the author! While you can use it for free, remember that republishing the code is subject to our House Rules.
Disclaimer
The information and publications are not meant to be, and do not constitute, financial, investment, trading, or other types of advice or recommendations supplied or endorsed by TradingView. Read more in the Terms of Use.