OPEN-SOURCE SCRIPT
Updated MA+ Projection
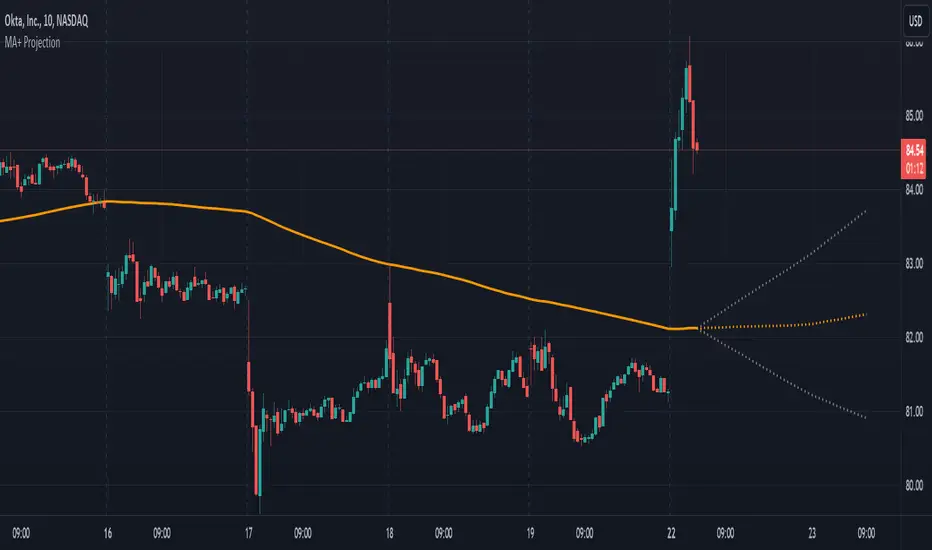
The "MA+ Projection" indicator is designed to visualize the potential future direction of a moving average, taking into account the impact of historical data loss. It is primarily aimed at providing a practical perspective on how moving averages could evolve as older data points are no longer considered.
Key Features:
How It Works:
Given the specified parameters, it takes the selected moving average type (a known formula like SMA, EMA, or WMA), and projects the future data points by continuing to move the data 'window' forward without adding any more data. By default, it extends the average by assuming the price hasn't changed after the last bar. Alternatively, the projection can be the result of shrinking the window as it moves forward without adding any new data points.
Note:
This tool is for visual projection, not prediction. Its purpose is to aid in the analysis of potential future trends based on historical data, not to provide definitive market forecasts.
Key Features:
- Supported Moving Averages: SMA, EMA, WMA, VWMA, and VAWMA (Volume Adjusted WMA).
- Flexible Time Span Settings: Customize the moving average length in bars, minutes, or days.
- Adjustable Projection Scope: Set a percentage of the measurement to project forward.
- Projection 'Cone': Show/hide the deviation and control the multiple.
- Use Last Source Value: An option to add the latest known value to the moving window instead of only letting the window shrink. (Enabled by default.)
How It Works:
Given the specified parameters, it takes the selected moving average type (a known formula like SMA, EMA, or WMA), and projects the future data points by continuing to move the data 'window' forward without adding any more data. By default, it extends the average by assuming the price hasn't changed after the last bar. Alternatively, the projection can be the result of shrinking the window as it moves forward without adding any new data points.
Note:
This tool is for visual projection, not prediction. Its purpose is to aid in the analysis of potential future trends based on historical data, not to provide definitive market forecasts.
Release Notes
Fixes a bug in the calculation.Release Notes
Thumbnail update.Release Notes
- Added 'Start of Data' highlight option.
- Improved configuration screen layout.
- Improved code format and readability.
Release Notes
Fixed bug in length value configuration.Open-source script
In true TradingView spirit, the creator of this script has made it open-source, so that traders can review and verify its functionality. Kudos to the author! While you can use it for free, remember that republishing the code is subject to our House Rules.
Disclaimer
The information and publications are not meant to be, and do not constitute, financial, investment, trading, or other types of advice or recommendations supplied or endorsed by TradingView. Read more in the Terms of Use.
Open-source script
In true TradingView spirit, the creator of this script has made it open-source, so that traders can review and verify its functionality. Kudos to the author! While you can use it for free, remember that republishing the code is subject to our House Rules.
Disclaimer
The information and publications are not meant to be, and do not constitute, financial, investment, trading, or other types of advice or recommendations supplied or endorsed by TradingView. Read more in the Terms of Use.