OPEN-SOURCE SCRIPT
SHILLER_PE_RATIO_MONTH
DISCRIPTION
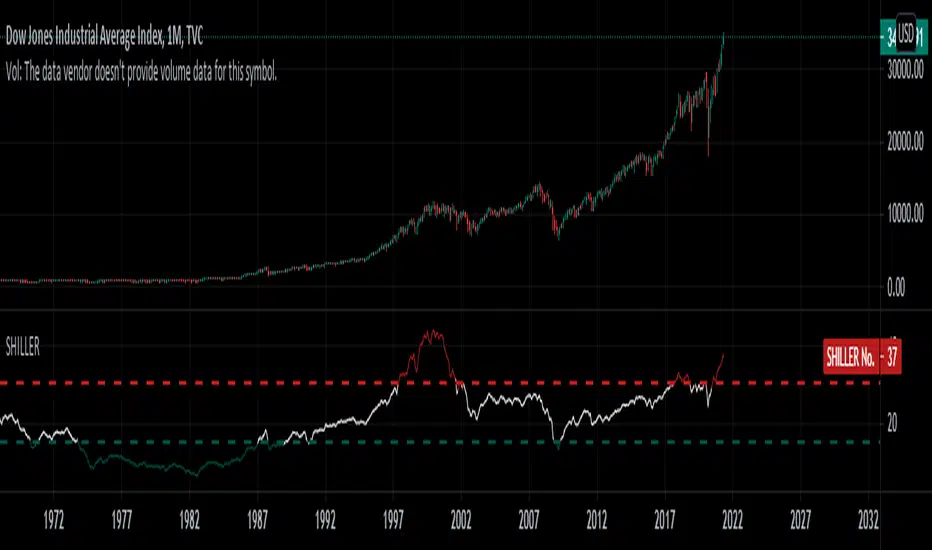
Shiller PE ratio for the S&P 500. Price earnings ratio is based on average inflation-adjusted earnings from the previous 10 years, known as the Cyclically Adjusted PE Ratio (CAPE Ratio)
TIME FRAME
1M
HOW TO USE
It provide historic Shiller PE which will provide over-bought or over-sold condition historically from 19th century.
MODIFICATION
When the pe ratio crosses 30 considered as Greed
When the pe ratio fall below 15 considered as Fear
Open-source script
In true TradingView spirit, the creator of this script has made it open-source, so that traders can review and verify its functionality. Kudos to the author! While you can use it for free, remember that republishing the code is subject to our House Rules.
Disclaimer
The information and publications are not meant to be, and do not constitute, financial, investment, trading, or other types of advice or recommendations supplied or endorsed by TradingView. Read more in the Terms of Use.