OPEN-SOURCE SCRIPT
RSI + 200 EMA Strategy
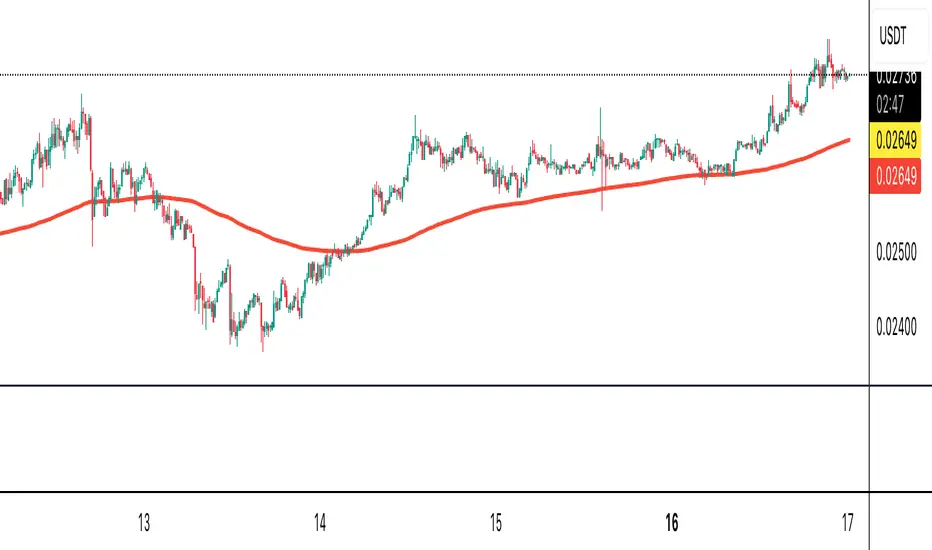
🔹 Rules to follow (5-minute)
✅ Buy (Long) when:
➥ Price is above 200 EMA (uptrend).
➥ RSI drops below 30 (oversold) and then crosses back above 30.
➥ Ideally, you enter after the first green 5-minute candle following the RSI reversal.
✅ Sell (Short) when:
➥ Price is below 200 EMA (downtrend).
➥ RSI crosses above 70 (overbought) and then drops back below 70.
➥ Ideally, you enter after the first red 5-minute candle following the reversal.
Open-source script
In true TradingView spirit, the creator of this script has made it open-source, so that traders can review and verify its functionality. Kudos to the author! While you can use it for free, remember that republishing the code is subject to our House Rules.
Disclaimer
The information and publications are not meant to be, and do not constitute, financial, investment, trading, or other types of advice or recommendations supplied or endorsed by TradingView. Read more in the Terms of Use.