OPEN-SOURCE SCRIPT
Updated ADX Trend Filter
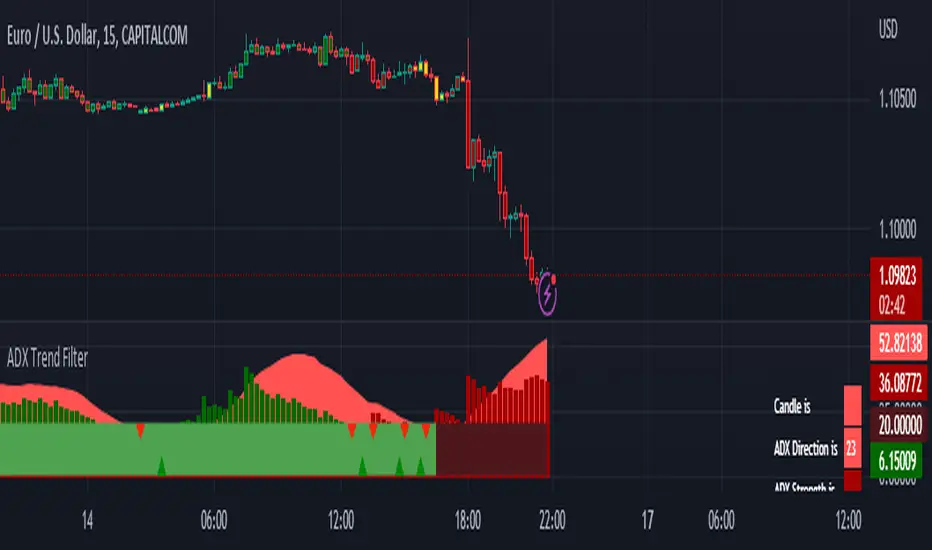
ADX Trend Filter Indicator is a traditional ADX indicator with a different presentation. its consist of two indicators EMA TREND and ADX / DMI
About Indicator:
1. BAND / EMA band to represent EMA Trend of EMA-12 and EMA-50
(Band is plotted at level-20 which is the Threshold level of DMI / ADX indicator)
2. Histogram showing the direction of ADX / DMI trend
3. Area behind the histogram showing ADX/DMI strength
How to use?
1. Histogram represents current Trend Red for Bearish / Green for Bullish
2. Area behind the histogram represents Strength of ADX / DMI Threshold level is 0-20(represented as band). (Area below the Band is Sideways)
3. Band represents the current MA Trend.
4. Buy Sell signals are plotted as triangles in red/green obtained from ADX / DMI Crossovers
Buy Signal (Green Triangle on band- ADX Crossover)
1.Band below Histogram must be Green
2.Histogram must be green
3.Area behind histogram must be above the lower trend band (20level) and visible
Sell Signal (Red Triangle on band- ADX Crossover)
1.Band below Histogram must be Red
2.Histogram must be Red
3.Area behind histogram must be above the lower trend band (20level) and visible
Alerts provided for ADX crossovers.
Release Notes
=>Minor Plot X shape Bug Fixed.=>Status Table Provided
Release Notes
Table Text Color option ProvidedOpen-source script
In true TradingView spirit, the creator of this script has made it open-source, so that traders can review and verify its functionality. Kudos to the author! While you can use it for free, remember that republishing the code is subject to our House Rules.
Disclaimer
The information and publications are not meant to be, and do not constitute, financial, investment, trading, or other types of advice or recommendations supplied or endorsed by TradingView. Read more in the Terms of Use.
Open-source script
In true TradingView spirit, the creator of this script has made it open-source, so that traders can review and verify its functionality. Kudos to the author! While you can use it for free, remember that republishing the code is subject to our House Rules.
Disclaimer
The information and publications are not meant to be, and do not constitute, financial, investment, trading, or other types of advice or recommendations supplied or endorsed by TradingView. Read more in the Terms of Use.