OPEN-SOURCE SCRIPT
Updated Smoothed ROC Z-Score with Table
Smoothed ROC Z-Score with Table
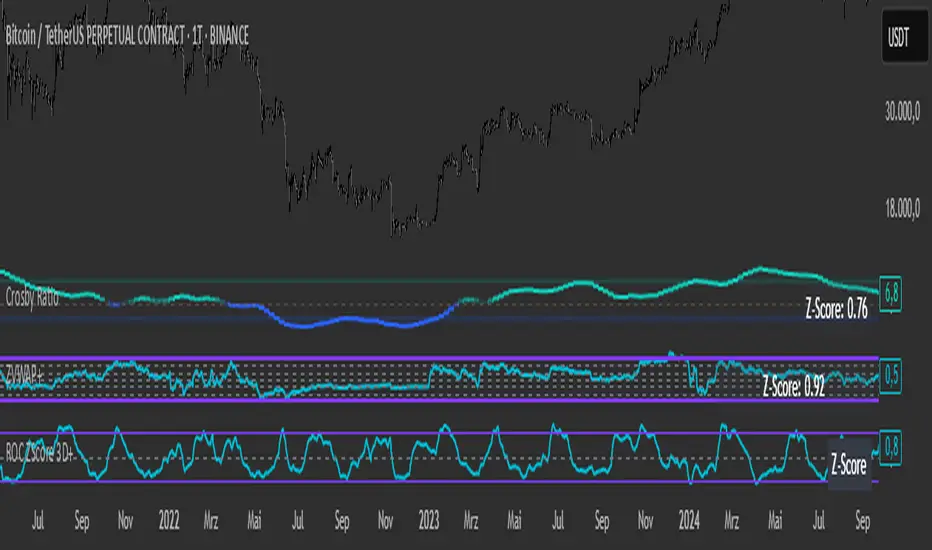
This indicator calculates the Rate of Change (ROC) of a chosen price source and transforms it into a smoothed Z-Score oscillator, allowing you to identify market cycle tops and bottoms with reduced noise.
How it works:
The ROC is calculated over a user-defined length.
A moving average and standard deviation over a separate window are used to standardize the ROC into a Z-Score.
This Z-Score is further smoothed using an exponential moving average (EMA) to filter noise and highlight clearer cycle signals.
The smoothed Z-Score oscillates around zero, with upper and lower bands defined by user inputs (default ±2 standard deviations).
When the Z-Score reaches or exceeds ±3 (customizable), the value shown in the table is clamped at ±2 for clearer interpretation.
The indicator plots the smoothed Z-Score line with zero and band lines, and displays a colored Z-Score table on the right for quick reference.
How to read it:
Values near zero indicate neutral momentum.
Rising Z-Scores towards the upper band suggest increasing positive momentum, possible market tops or strength.
Falling Z-Scores towards the lower band indicate negative momentum, potential bottoms or weakness.
The color-coded table gives an easy visual cue: red/orange for strong positive signals, green/teal for strong negative signals, and gray for neutral zones.
Use cases:
Identify turning points in trending markets.
Filter noisy ROC data for cleaner signals.
Combine with other indicators to time entries and exits more effectively.
Release Notes
Smoothed ROC Z-Score with TableThis indicator calculates the Rate of Change (ROC) of a chosen price source and transforms it into a smoothed Z-Score oscillator, allowing you to identify market cycle tops and bottoms with reduced noise.
How it works:
The ROC is calculated over a user-defined length.
A moving average and standard deviation over a separate window are used to standardize the ROC into a Z-Score.
This Z-Score is further smoothed using an exponential moving average (EMA) to filter noise and highlight clearer cycle signals.
The smoothed Z-Score oscillates around zero, with upper and lower bands defined by user inputs (default ±2 standard deviations).
When the Z-Score reaches or exceeds ±3 (customizable), the value shown in the table is clamped at ±2 for clearer interpretation.
The indicator plots the smoothed Z-Score line with zero and band lines, and displays a colored Z-Score table on the right for quick reference.
How to read it:
Values near zero indicate neutral momentum.
Rising Z-Scores towards the upper band suggest increasing positive momentum, possible market tops or strength.
Falling Z-Scores towards the lower band indicate negative momentum, potential bottoms or weakness.
The color-coded table gives an easy visual cue: red/orange for strong positive signals, green/teal for strong negative signals, and gray for neutral zones.
Use cases:
Identify turning points in trending markets.
Filter noisy ROC data for cleaner signals.
Combine with other indicators to time entries and exits more effectively.
Open-source script
In true TradingView spirit, the creator of this script has made it open-source, so that traders can review and verify its functionality. Kudos to the author! While you can use it for free, remember that republishing the code is subject to our House Rules.
Disclaimer
The information and publications are not meant to be, and do not constitute, financial, investment, trading, or other types of advice or recommendations supplied or endorsed by TradingView. Read more in the Terms of Use.