OPEN-SOURCE SCRIPT
Updated TICK Extremes Indicator
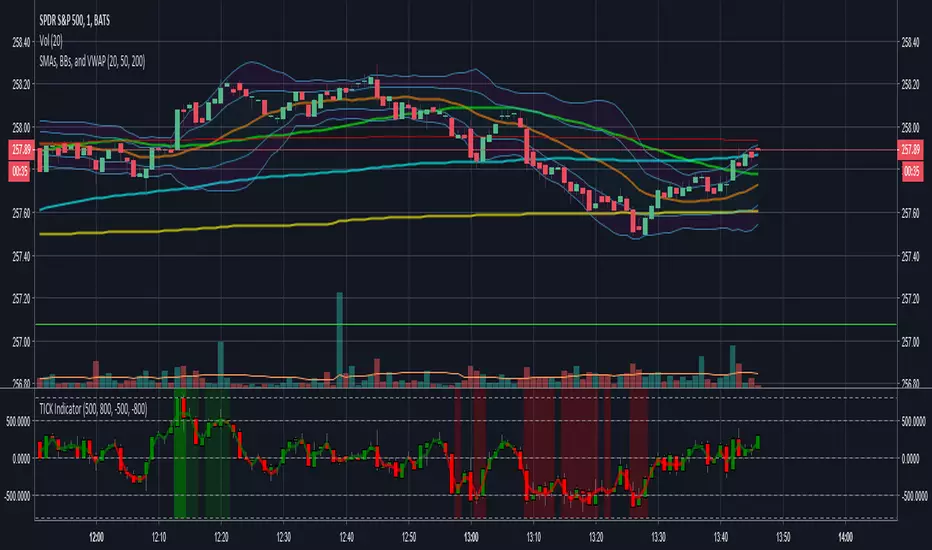
Simple TICK indicator, plots candles and HL2 line
Conditional green/red coloring for highs above 500, 900 and lows above 0, and for lows below -500, -900, and highs above 0
Probably best used for 1 - 5 min timeframes
Always open to suggestions if criteria needs tweaking or if something else would make it more useful or user-friendly!
Conditional green/red coloring for highs above 500, 900 and lows above 0, and for lows below -500, -900, and highs above 0
Probably best used for 1 - 5 min timeframes
Always open to suggestions if criteria needs tweaking or if something else would make it more useful or user-friendly!
Release Notes
Cleaned up old code used during testing not used in final productRelease Notes
Added high/low criteria as inputs so users can adjust as desired, hlines adjust with criteria as wellOpen-source script
In true TradingView spirit, the creator of this script has made it open-source, so that traders can review and verify its functionality. Kudos to the author! While you can use it for free, remember that republishing the code is subject to our House Rules.
Disclaimer
The information and publications are not meant to be, and do not constitute, financial, investment, trading, or other types of advice or recommendations supplied or endorsed by TradingView. Read more in the Terms of Use.
Open-source script
In true TradingView spirit, the creator of this script has made it open-source, so that traders can review and verify its functionality. Kudos to the author! While you can use it for free, remember that republishing the code is subject to our House Rules.
Disclaimer
The information and publications are not meant to be, and do not constitute, financial, investment, trading, or other types of advice or recommendations supplied or endorsed by TradingView. Read more in the Terms of Use.