OPEN-SOURCE SCRIPT
Updated 20,200SMA,PDHL,15 minute ORB
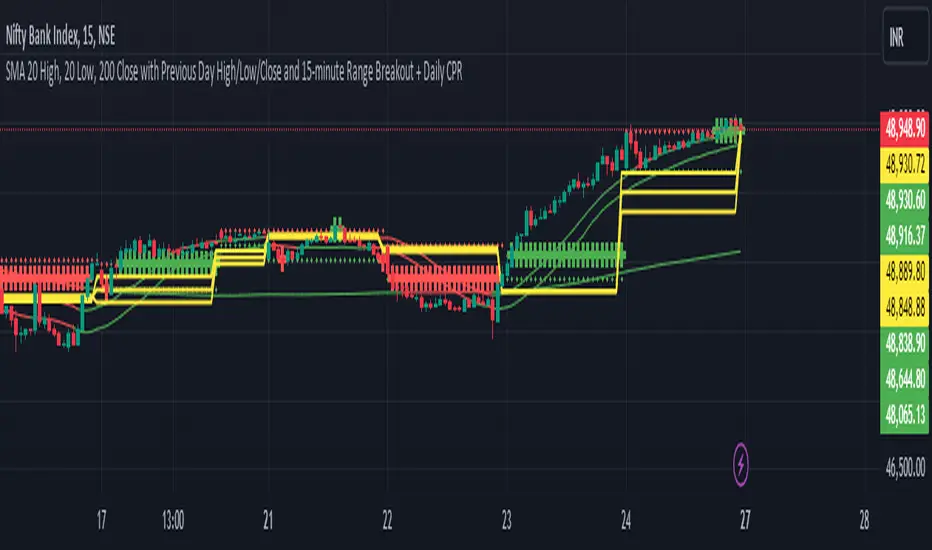
Simple Moving Averages (SMAs):
The script calculates three SMAs: SMA 20 High, SMA 20 Low, and SMA 200 Close. These moving averages are widely used in technical analysis to smooth out price data and identify trends.
The SMA for the high price (SMA 20 High) is calculated based on the 20-period moving average of the high prices.
Similarly, the SMA for the low price (SMA 20 Low) is calculated based on the 20-period moving average of the low prices.
The SMA for the close price (SMA 200 Close) is calculated based on the 200-period moving average of the closing prices.
Each SMA is plotted on the chart, and their colors are determined based on whether the current close price is above or below each respective SMA.
Conditional Coloring:
The script employs conditional coloring to visually highlight whether the close price is above or below each SMA.
If the close price is below the SMA 20 High, it's plotted in red; otherwise, it's plotted in green.
Similarly, the SMA 20 Low and SMA 200 Close are plotted with conditional colors based on the relationship between the close price and each respective SMA.
Previous Day's Data:
The script retrieves and plots the high, low, and close prices of the previous trading day.
This provides traders with valuable information about the previous day's market behavior, which can influence trading decisions.
Opening 15-minute Range Breakout:
The script calculates the high and low prices during the first 15 minutes of each trading day.
These prices represent the opening range for the day.
It then determines whether the current close price is above or below this opening range and plots it accordingly.
This breakout strategy helps traders identify potential trading opportunities based on early price movements.
By integrating these components, the script offers traders a comprehensive analysis of market trends, previous day's performance, and potential breakout opportunities. Its originality lies in the combination of these features into a single, easy-to-use indicator, providing valuable insights for trading decisions.
Release Notes
this update contain a additional central pivot range a concept well known used by nick scot,francklin oachaand based on CPR range and opening price different strategy are made
Open-source script
In true TradingView spirit, the creator of this script has made it open-source, so that traders can review and verify its functionality. Kudos to the author! While you can use it for free, remember that republishing the code is subject to our House Rules.
Disclaimer
The information and publications are not meant to be, and do not constitute, financial, investment, trading, or other types of advice or recommendations supplied or endorsed by TradingView. Read more in the Terms of Use.