OPEN-SOURCE SCRIPT
Gold Breakout Strategy - RR 4
Strategy Name: Gold Breakout Strategy - RR 4
🧠 Main Objective
This strategy aims to capitalize on breakouts from the Donchian Channel on Gold (XAU/USD) by filtering trades with:
Volume confirmation,
A custom momentum indicator (LWTI - Linear Weighted Trend Index),
And a specific trading session (8 PM to 8 AM Quebec time — GMT-5).
It takes only one trade per day, either a buy or a sell, using a fixed stop-loss at the wick of the breakout candle and a 4:1 reward-to-risk (RR) ratio.
📊 Indicators Used
Donchian Channel
Length: 96
Detects breakouts of recent highs or lows.
Volume
Simple Moving Average (SMA) over 30 bars.
A breakout is only valid if the current volume is above the SMA.
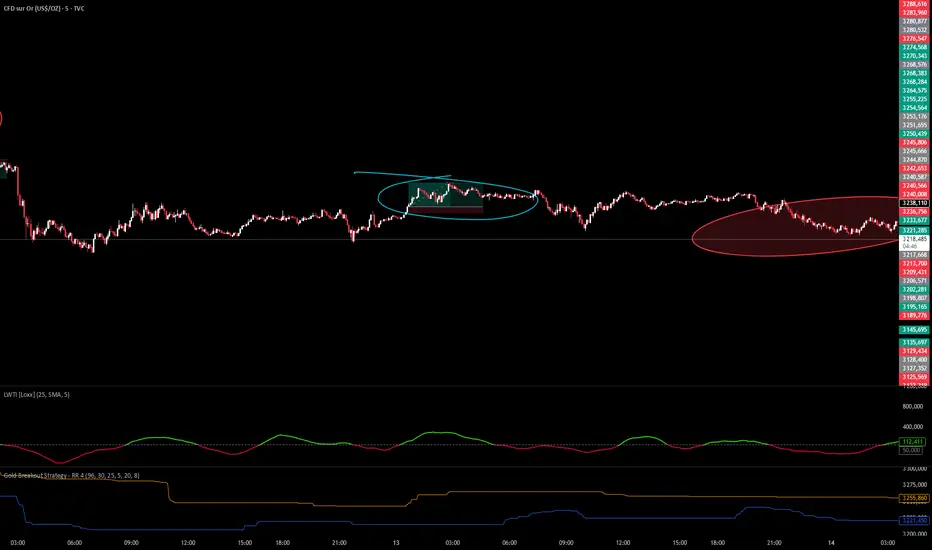
LWTI (Linear Weighted Trend Index)
Measures momentum using price differences over 25 bars, smoothed over 5.
Used to confirm trend direction:
Buy when LWTI > its smoothed version (uptrend).
Sell when LWTI < its smoothed version (downtrend).
⏰ Time Filter
The strategy only allows entries between 8 PM and 8 AM (GMT-5 / Quebec time).
A timestamp-based filter ensures the system recognizes the correct trading session even across midnight.
📌 Entry Conditions
🟢 Buy (Long)
Price breaks above the previous Donchian Channel high.
The current channel high is higher than the previous one.
Volume is above its moving average.
LWTI confirms an uptrend.
The time is within the trading session (20:00 to 08:00).
No trade has been taken yet today.
🔴 Sell (Short)
Price breaks below the previous Donchian Channel low.
The current channel low is lower than the previous one.
Volume is above its moving average.
LWTI confirms a downtrend.
The time is within the trading session.
No trade has been taken yet today.
💸 Trade Management
Stop-Loss (SL):
For long entries: placed below the wick low of the breakout candle.
For short entries: placed above the wick high of the breakout candle.
Take-Profit (TP):
Set at a fixed 4:1 reward-to-risk ratio.
Calculated as 4x the distance between the entry price and stop-loss.
No trailing stop, no break-even, no scaling in/out.
🎨 Visuals
Green triangle appears below the candle on a buy signal.
Red triangle appears above the candle on a sell signal.
Donchian Channel lines are plotted on the chart.
The strategy is designed for the 5-minute timeframe.
🔄 One Trade Per Day Rule
Once a trade is taken (buy or sell), no more trades will be executed for the rest of the day. This prevents overtrading and limits exposure.
🧠 Main Objective
This strategy aims to capitalize on breakouts from the Donchian Channel on Gold (XAU/USD) by filtering trades with:
Volume confirmation,
A custom momentum indicator (LWTI - Linear Weighted Trend Index),
And a specific trading session (8 PM to 8 AM Quebec time — GMT-5).
It takes only one trade per day, either a buy or a sell, using a fixed stop-loss at the wick of the breakout candle and a 4:1 reward-to-risk (RR) ratio.
📊 Indicators Used
Donchian Channel
Length: 96
Detects breakouts of recent highs or lows.
Volume
Simple Moving Average (SMA) over 30 bars.
A breakout is only valid if the current volume is above the SMA.
LWTI (Linear Weighted Trend Index)
Measures momentum using price differences over 25 bars, smoothed over 5.
Used to confirm trend direction:
Buy when LWTI > its smoothed version (uptrend).
Sell when LWTI < its smoothed version (downtrend).
⏰ Time Filter
The strategy only allows entries between 8 PM and 8 AM (GMT-5 / Quebec time).
A timestamp-based filter ensures the system recognizes the correct trading session even across midnight.
📌 Entry Conditions
🟢 Buy (Long)
Price breaks above the previous Donchian Channel high.
The current channel high is higher than the previous one.
Volume is above its moving average.
LWTI confirms an uptrend.
The time is within the trading session (20:00 to 08:00).
No trade has been taken yet today.
🔴 Sell (Short)
Price breaks below the previous Donchian Channel low.
The current channel low is lower than the previous one.
Volume is above its moving average.
LWTI confirms a downtrend.
The time is within the trading session.
No trade has been taken yet today.
💸 Trade Management
Stop-Loss (SL):
For long entries: placed below the wick low of the breakout candle.
For short entries: placed above the wick high of the breakout candle.
Take-Profit (TP):
Set at a fixed 4:1 reward-to-risk ratio.
Calculated as 4x the distance between the entry price and stop-loss.
No trailing stop, no break-even, no scaling in/out.
🎨 Visuals
Green triangle appears below the candle on a buy signal.
Red triangle appears above the candle on a sell signal.
Donchian Channel lines are plotted on the chart.
The strategy is designed for the 5-minute timeframe.
🔄 One Trade Per Day Rule
Once a trade is taken (buy or sell), no more trades will be executed for the rest of the day. This prevents overtrading and limits exposure.
Open-source script
In true TradingView spirit, the creator of this script has made it open-source, so that traders can review and verify its functionality. Kudos to the author! While you can use it for free, remember that republishing the code is subject to our House Rules.
Disclaimer
The information and publications are not meant to be, and do not constitute, financial, investment, trading, or other types of advice or recommendations supplied or endorsed by TradingView. Read more in the Terms of Use.