OPEN-SOURCE SCRIPT
Updated Rolling summary
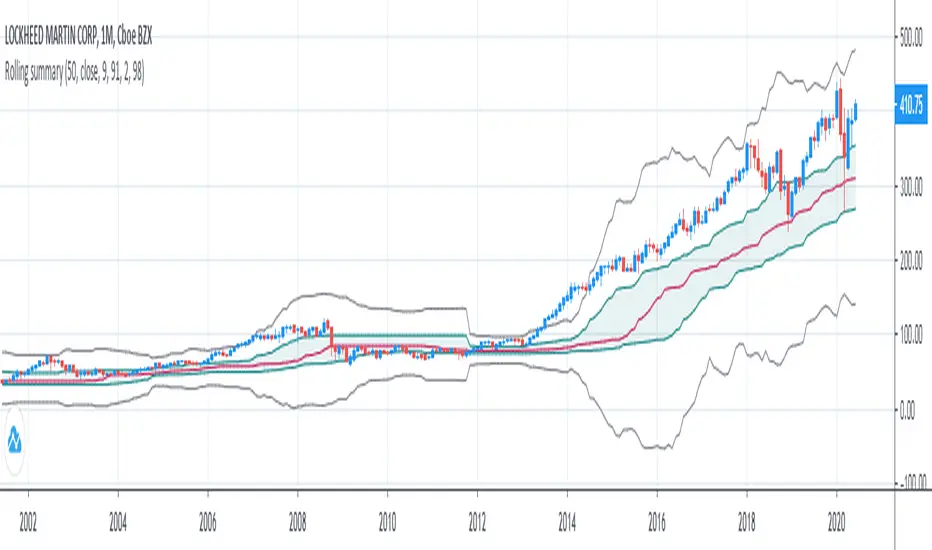
Statistical methods based on mean cannot be effective all the time when attributed to financial data since it doesn't usually follow normal distribution, the data can be skewed or/and have extreme values which can be described as outliers.
In order to deal with this problem it is appropriate to use median-based techniques.
The most common one is called five-number summary/box plot, which plots median of the dataset, 25th (Q1) & 75th (Q3) percentiles (the medians of lower & upper parts of the original dataset divided by the original median), and whiskers calculated by taking range between Q1 and Q3, multiplying it by 1.5 and adding it to Q3 and subtracting it from Q1. The values which are outside the whiskers are considered outliers. Default settings of the script correspond to the classic box plot.
Seven-number summary can be also plotted by this script, by turning on 4 additional percentiles/Bowley’s seven-figure summary by turning on first 2 additional percentiles and changing their values to 10 and 90 respectively.
P.S.: Mean can be also turned in just to check the difference.
Release Notes
Logarithmic calculations are now availableLong story short, while using logarithmic scale on your chart/you realize the volatility starts to follow exponential law, "log-space" should be checked.
Wanned to change the color scheme a bit but decided to leave it like that for now
Release Notes
Changed the colors a bit after allRelease Notes
Midpoint statistic (disabled by default) was added for research purposes. It's generally advised to use midpoint instead of other central tendency measures when the sample size is too smallRelease Notes
The proper name of the thing I've just addes is "Mid-range", fixedRelease Notes
New:- All data switch;
- OTF functionality.
Release Notes
New:- Whiskers multiplier (defaults are 1.5 and 3).
Open-source script
In true TradingView spirit, the creator of this script has made it open-source, so that traders can review and verify its functionality. Kudos to the author! While you can use it for free, remember that republishing the code is subject to our House Rules.
Gor Dragongor
Disclaimer
The information and publications are not meant to be, and do not constitute, financial, investment, trading, or other types of advice or recommendations supplied or endorsed by TradingView. Read more in the Terms of Use.