OPEN-SOURCE SCRIPT
Ultimate Gold Correlation Matrix (Extended)
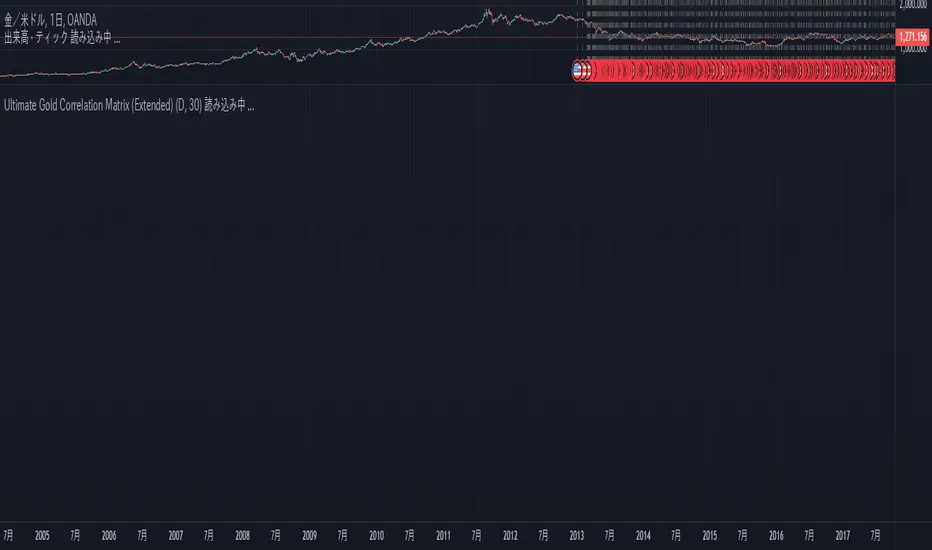
This is a correlation matrix to help you visually understand the relationship between stocks. This is the correlation of the amount of change.
The color changes depending on the value of the correlation value.
By drawing a node diagram of this relationship, you may be able to clarify what has been difficult to understand so far.
The color changes depending on the value of the correlation value.
By drawing a node diagram of this relationship, you may be able to clarify what has been difficult to understand so far.
Open-source script
In true TradingView spirit, the creator of this script has made it open-source, so that traders can review and verify its functionality. Kudos to the author! While you can use it for free, remember that republishing the code is subject to our House Rules.
Disclaimer
The information and publications are not meant to be, and do not constitute, financial, investment, trading, or other types of advice or recommendations supplied or endorsed by TradingView. Read more in the Terms of Use.