OPEN-SOURCE SCRIPT
Updated Gaps Enhanced
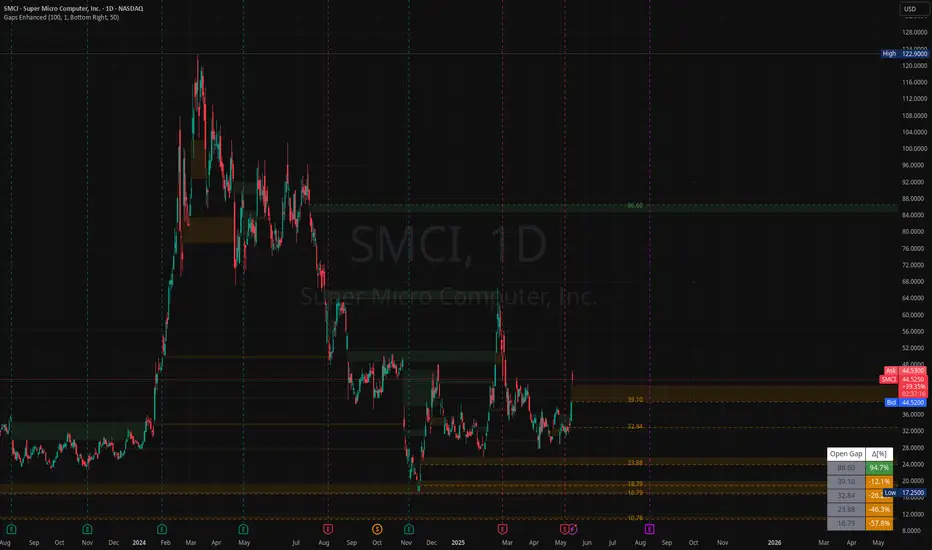
This advanced gap detection tool identifies and visualizes price gaps on trading charts, helping traders spot potential support/resistance levels and trading opportunities.
🔲 Components and Features
Visual gap boxes with directional coloring
Dynamic labels showing key price levels
Smart sorting of nearest gaps
Customizable appearance
Key Features
Gap Visualization
Colored boxes (orange for support, green for resistance)
Dashed lines marking gap boundaries
Right-aligned price labels
Smart Gap Table
Shows 5 most relevant open gaps
Sorted by proximity to current price
Displays required move percentage to fill each gap
Customization Options
Adjustable gap size threshold
Color customization
Label positioning controls
Table location settings
How To Use
Basic Interpretation
Orange boxes: Price gaped up might come back (support zones)
Green boxes: Price gaped down price might come back to close the gap (resistance zones)
The table shows how much the price needs to move to fill each gap (as percentage)
Trading Applications
Look for price reactions near gap levels
Trade bounces off support/resistance gaps
Watch for gap fills as potential trend continuation signals
Use nearest gaps as profit targets
Settings Guide
Minimal Deviation: Set minimum gap size
Max Number of Gaps: Limits how many gaps are tracked
Visual Settings: Customize colors and label positions
Table Position: Choose where the info table appears
Pro Tips
Combine with other indicators for confirmation
Watch for volume spikes at gap levels
Larger gaps often act as stronger S/R
Release Notes
This advanced gap detection tool identifies and visualizes price gaps on trading charts, helping traders spot potential support/resistance levels and trading opportunities.🔲 Components and Features
Visual gap boxes with directional coloring
Dynamic labels showing key price levels
Smart sorting of nearest gaps
Customizable appearance
Key Features
Gap Visualization
Colored boxes (orange for support, green for resistance)
Dashed lines marking gap boundaries
Right-aligned price labels
Smart Gap Table
Shows 5 most relevant open gaps
Sorted by proximity to current price
Displays required move percentage to fill each gap
Customization Options
Adjustable gap size threshold
Color customization
Label positioning controls
Table location settings
How To Use
Basic Interpretation
Orange boxes: Price gaped up might come back (support zones)
Green boxes: Price gaped down price might come back to close the gap (resistance zones)
The table shows how much the price needs to move to fill each gap (as percentage)
Trading Applications
Look for price reactions near gap levels
Trade bounces off support/resistance gaps
Watch for gap fills as potential trend continuation signals
Use nearest gaps as profit targets
Settings Guide
Minimal Deviation: Set minimum gap size
Max Number of Gaps: Limits how many gaps are tracked
Visual Settings: Customize colors and label positions
Table Position: Choose where the info table appears
Pro Tips
Combine with other indicators for confirmation
Watch for volume spikes at gap levels
Larger gaps often act as stronger S/R
Fixes
May 05 08:32:39 2025 UTC -> fixed wrong ordering of gaps in the table
Release Notes
This advanced gap detection tool identifies and visualizes price gaps on trading charts, helping traders spot potential support/resistance levels and trading opportunities.🔲 Components and Features
Visual gap boxes with directional coloring
Dynamic labels showing key price levels
Smart sorting of nearest gaps
Customizable appearance
Key Features
Gap Visualization
Colored boxes (orange for support, green for resistance)
Dashed lines marking gap boundaries
Right-aligned price labels
Smart Gap Table
Shows 5 most relevant open gaps
Sorted by proximity to current price
Displays required move percentage to fill each gap
Customization Options
Adjustable gap size threshold
Color customization
Label positioning controls
Table location settings
How To Use
Basic Interpretation
Orange boxes: Price gaped up might come back (support zones)
Green boxes: Price gaped down price might come back to close the gap (resistance zones)
The table shows how much the price needs to move to fill each gap (as percentage)
Trading Applications
Look for price reactions near gap levels
Trade bounces off support/resistance gaps
Watch for gap fills as potential trend continuation signals
Use nearest gaps as profit targets
Settings Guide
Minimal Deviation: Set minimum gap size
Max Number of Gaps: Limits how many gaps are tracked
Visual Settings: Customize colors and label positions
Table Position: Choose where the info table appears
Pro Tips
Combine with other indicators for confirmation
Watch for volume spikes at gap levels
Larger gaps often act as stronger S/R
7 days ago
Release Notes
This advanced gap detection tool identifies and visualizes price gaps on trading charts, helping traders spot potential support/resistance levels and trading opportunities.
🔲 Components and Features
Visual gap boxes with directional coloring
Dynamic labels showing key price levels
Smart sorting of nearest gaps
Customizable appearance
Key Features
Gap Visualization
Colored boxes (orange for support, green for resistance)
Dashed lines marking gap boundaries
Right-aligned price labels
Smart Gap Table
Shows 5 most relevant open gaps
Sorted by proximity to current price
Displays required move percentage to fill each gap
Customization Options
Adjustable gap size threshold
Color customization
Label positioning controls
Table location settings
How To Use
Basic Interpretation
Orange boxes: Price gaped up might come back (support zones)
Green boxes: Price gaped down price might come back to close the gap (resistance zones)
The table shows how much the price needs to move to fill each gap (as percentage)
Trading Applications
Look for price reactions near gap levels
Trade bounces off support/resistance gaps
Watch for gap fills as potential trend continuation signals
Use nearest gaps as profit targets
Settings Guide
Minimal Deviation: Set minimum gap size
Max Number of Gaps: Limits how many gaps are tracked
Visual Settings: Customize colors and label positions
Table Position: Choose where the info table appears
Pro Tips
Combine with other indicators for confirmation
Watch for volume spikes at gap levels
Larger gaps often act as stronger S/R
Fixes
May 05 08:32:39 2025 UTC -> fixed wrong ordering of gaps in the table
Release Notes
This advanced gap detection tool identifies and visualizes price gaps on trading charts, helping traders spot potential support/resistance levels and trading opportunities.🔲 Components and Features
Visual gap boxes with directional coloring
Dynamic labels showing key price levels
Smart sorting of nearest gaps
Customizable appearance
Key Features
Gap Visualization
Colored boxes (orange for support, green for resistance)
Dashed lines marking gap boundaries
Right-aligned price labels
Smart Gap Table
Shows 5 most relevant open gaps
Sorted by proximity to current price
Displays required move percentage to fill each gap
Customization Options
Adjustable gap size threshold
Color customization
Label positioning controls
Table location settings
How To Use
Basic Interpretation
Orange boxes: Price gaped up might come back (support zones)
Green boxes: Price gaped down price might come back to close the gap (resistance zones)
The table shows how much the price needs to move to fill each gap (as percentage)
Trading Applications
Look for price reactions near gap levels
Trade bounces off support/resistance gaps
Watch for gap fills as potential trend continuation signals
Use nearest gaps as profit targets
Settings Guide
Minimal Deviation: Set minimum gap size
Max Number of Gaps: Limits how many gaps are tracked
Visual Settings: Customize colors and label positions
Table Position: Choose where the info table appears
Pro Tips
Combine with other indicators for confirmation
Watch for volume spikes at gap levels
Larger gaps often act as stronger S/R
May 5
Release Notes
This advanced gap detection tool identifies and visualizes price gaps on trading charts, helping traders spot potential support/resistance levels and trading opportunities.
🔲 Components and Features
Visual gap boxes with directional coloring
Dynamic labels showing key price levels
Smart sorting of nearest gaps
Customizable appearance
Key Features
Gap Visualization
Colored boxes (orange for support, green for resistance)
Dashed lines marking gap boundaries
Right-aligned price labels
Smart Gap Table
Shows 5 most relevant open gaps
Sorted by proximity to current price
Displays required move percentage to fill each gap
Customization Options
Adjustable gap size threshold
Color customization
Label positioning controls
Table location settings
How To Use
Basic Interpretation
Orange boxes: Price gaped up might come back (support zones)
Green boxes: Price gaped down price might come back to close the gap (resistance zones)
The table shows how much the price needs to move to fill each gap (as percentage)
Trading Applications
Look for price reactions near gap levels
Trade bounces off support/resistance gaps
Watch for gap fills as potential trend continuation signals
Use nearest gaps as profit targets
Settings Guide
Minimal Deviation: Set minimum gap size
Max Number of Gaps: Limits how many gaps are tracked
Visual Settings: Customize colors and label positions
Table Position: Choose where the info table appears
Pro Tips
Combine with other indicators for confirmation
Watch for volume spikes at gap levels
Larger gaps often act as stronger S/R
Fixes
May 05 08:32:39 2025 UTC -> fixed wrong ordering of gaps in the table
2 days ago
Release Notes
This advanced gap detection tool identifies and visualizes price gaps on trading charts, helping traders spot potential support/resistance levels and trading opportunities.
🔲 Components and Features
Visual gap boxes with directional coloring
Dynamic labels showing key price levels
Smart sorting of nearest gaps
Customizable appearance
Key Features
Gap Visualization
Colored boxes (orange for support, green for resistance)
Dashed lines marking gap boundaries
Right-aligned price labels
Smart Gap Table
Shows 5 most relevant open gaps
Sorted by proximity to current price
Displays required move percentage to fill each gap
Customization Options
Adjustable gap size threshold
Color customization
Label positioning controls
Table location settings
How To Use
Basic Interpretation
Orange boxes: Price gaped up might come back (support zones)
Green boxes: Price gaped down price might come back to close the gap (resistance zones)
The table shows how much the price needs to move to fill each gap (as percentage)
Trading Applications
Look for price reactions near gap levels
Trade bounces off support/resistance gaps
Watch for gap fills as potential trend continuation signals
Use nearest gaps as profit targets
Settings Guide
Minimal Deviation: Set minimum gap size
Max Number of Gaps: Limits how many gaps are tracked
Visual Settings: Customize colors and label positions
Table Position: Choose where the info table appears
Pro Tips
Combine with other indicators for confirmation
Watch for volume spikes at gap levels
Larger gaps often act as stronger S/R
7 days ago
Release Notes
This advanced gap detection tool identifies and visualizes price gaps on trading charts, helping traders spot potential support/resistance levels and trading opportunities.
🔲 Components and Features
Visual gap boxes with directional coloring
Dynamic labels showing key price levels
Smart sorting of nearest gaps
Customizable appearance
Key Features
Gap Visualization
Colored boxes (orange for support, green for resistance)
Dashed lines marking gap boundaries
Right-aligned price labels
Smart Gap Table
Shows 5 most relevant open gaps
Sorted by proximity to current price
Displays required move percentage to fill each gap
Customization Options
Adjustable gap size threshold
Color customization
Label positioning controls
Table location settings
How To Use
Basic Interpretation
Orange boxes: Price gaped up might come back (support zones)
Green boxes: Price gaped down price might come back to close the gap (resistance zones)
The table shows how much the price needs to move to fill each gap (as percentage)
Trading Applications
Look for price reactions near gap levels
Trade bounces off support/resistance gaps
Watch for gap fills as potential trend continuation signals
Use nearest gaps as profit targets
Settings Guide
Minimal Deviation: Set minimum gap size
Max Number of Gaps: Limits how many gaps are tracked
Visual Settings: Customize colors and label positions
Table Position: Choose where the info table appears
Pro Tips
Combine with other indicators for confirmation
Watch for volume spikes at gap levels
Larger gaps often act as stronger S/R
Fixes
May 05 08:32:39 2025 UTC -> fixed wrong ordering of gaps in the table
May 14 17:22:39 2025 UTC -> fixed issue "Row 6 is out of table bounds, number of rows is 6."
Release Notes
This advanced gap detection tool identifies and visualizes price gaps on trading charts, helping traders spot potential support/resistance levels and trading opportunities.🔲 Components and Features
Visual gap boxes with directional coloring
Dynamic labels showing key price levels
Smart sorting of nearest gaps
Customizable appearance
Key Features
Gap Visualization
Colored boxes (orange for support, green for resistance)
Dashed lines marking gap boundaries
Right-aligned price labels
Smart Gap Table
Shows 5 most relevant open gaps
Sorted by proximity to current price
Displays required move percentage to fill each gap
Customization Options
Adjustable gap size threshold
Color customization
Label positioning controls
Table location settings
How To Use
Basic Interpretation
Orange boxes: Price gaped up might come back (support zones)
Green boxes: Price gaped down price might come back to close the gap (resistance zones)
The table shows how much the price needs to move to fill each gap (as percentage)
Trading Applications
Look for price reactions near gap levels
Trade bounces off support/resistance gaps
Watch for gap fills as potential trend continuation signals
Use nearest gaps as profit targets
Settings Guide
Minimal Deviation: Set minimum gap size
Max Number of Gaps: Limits how many gaps are tracked
Visual Settings: Customize colors and label positions
Table Position: Choose where the info table appears
Pro Tips
Combine with other indicators for confirmation
Watch for volume spikes at gap levels
Larger gaps often act as stronger S/R
Fixes
May 05 08:32:39 2025 UTC -> fixed wrong ordering of gaps in the table
May 14 17:22:39 2025 UTC -> fixed issue "Row 6 is out of table bounds, number of rows is 6."
Open-source script
In true TradingView spirit, the creator of this script has made it open-source, so that traders can review and verify its functionality. Kudos to the author! While you can use it for free, remember that republishing the code is subject to our House Rules.
Disclaimer
The information and publications are not meant to be, and do not constitute, financial, investment, trading, or other types of advice or recommendations supplied or endorsed by TradingView. Read more in the Terms of Use.