OPEN-SOURCE SCRIPT
Updated Adaptive Normalized Global Liquidity Oscillator
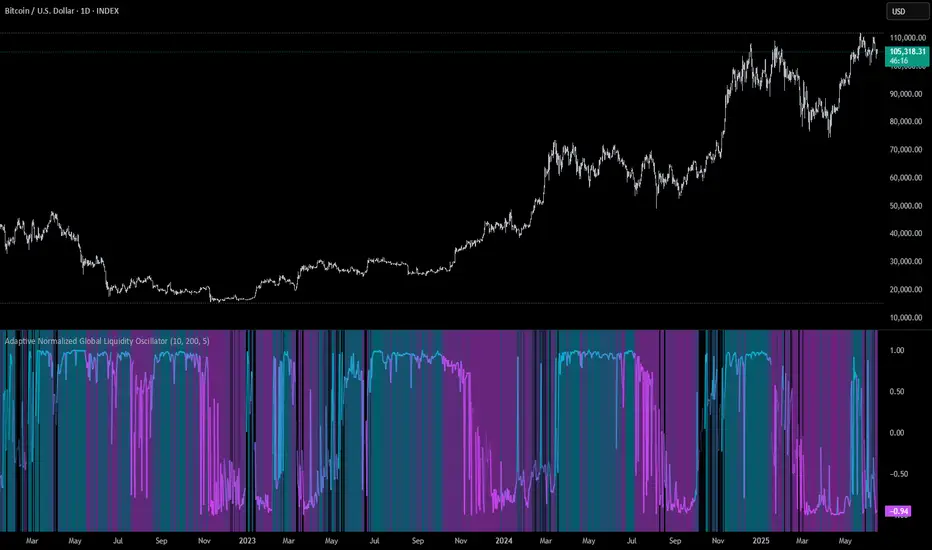
Adaptive Normalized Global Liquidity Oscillator
A dynamic, non-repainting oscillator built on real central bank balance sheet data. This tool visualizes global liquidity shifts by aggregating monetary asset flows from the world’s most influential central banks.
🔍 What This Script Does:
Aggregates Global Liquidity:
Includes Federal Reserve (FED) assets and subtracts liabilities like the Treasury General Account (TGA) and Reverse Repo Facility (RRP), combined with asset positions from the ECB, BOJ, PBC, BOE, and over 10 other central banks. All data is normalized into USD using FX rates.
Adaptive Normalization:
Optimizes the lookback period dynamically based on rate-of-change stability—no fixed lengths, enabling adaptation across macro conditions.
Self-Optimizing Weighting:
Applies inverse standard deviation to balance raw liquidity, smoothed momentum (HMA), and standardized deviation from the mean.
Percentile-Ranked Highlights:
Liquidity readings are ranked relative to history—extremes are visually emphasized using gradient color and adaptive transparency.
Non-Repainting Design:
Data is anchored with bar index awareness and offset techniques, ensuring no forward-looking bias. What you see is what was known at that time.
⚠️ Important Interpretation Note:
This is not a zero-centered oscillator like RSI or MACD. The signal line does not represent neutrality at zero.
Instead, a dynamic baseline is calculated using a rolling mean of scaled liquidity.
0 is irrelevant on its own—true directional signals come from crosses above or below this adaptive baseline.
Even negative values may signal strength if they are rising above the moving average of past liquidity conditions.
✅ What to Watch For:
Crossover Above Dynamic Baseline:
Indicates liquidity is expanding relative to recent conditions—supports a risk-on interpretation.
Crossover Below Dynamic Baseline:
Suggests deteriorating liquidity conditions—may align with risk-off shifts.
Percentile Extremes:
Readings near the top or bottom historical percentiles can act as contrarian or confirmation signals, depending on momentum.
⚙️ How It Works:
Bounded Normalization:
The final oscillator is passed through a tanh function, keeping values within [-1, 1] and reducing distortion.
Adaptive Transparency:
The strength of deviations dynamically adjusts plot intensity—visually highlighting stronger liquidity shifts.
Fully Customizable:
Toggle which banks are included, adjust dynamic optimization ranges, and control visual display options for plot and background layers.
🧠 How to Use:
Trend Confirmation:
Sustained rises in the oscillator above baseline suggest underlying monetary support for asset prices.
Macro Turning Points:
Reversals or divergences, especially near OB/OS zones, can foreshadow broader risk regime changes.
Visual Context:
Use the dynamic baseline to see if liquidity is supportive or suppressive relative to its own adaptive history.
📌 Disclaimer:
This indicator is for educational and informational purposes only. It does not constitute financial advice. Past performance is not indicative of future results. Always consult a qualified financial advisor before making trading or investment decisions.
Release Notes
Update: Stability & Runtime FixThis version addresses a critical runtime error caused by improper historical buffer handling in the original custom_hma() implementation. The diff input is now correctly handled as a time series, ensuring reliable lookbacks and eliminating offset-related crashes.
✅ Key Improvements:
Fixed runtime error: requested historical offset is beyond buffer limit
Rewrote custom_hma() to support proper series history
Replaced all : 0 fallbacks with : na for consistent time series initialization
Added defensive use of nz() and bar_index guards for stability
Open-source script
In true TradingView spirit, the creator of this script has made it open-source, so that traders can review and verify its functionality. Kudos to the author! While you can use it for free, remember that republishing the code is subject to our House Rules.
Disclaimer
The information and publications are not meant to be, and do not constitute, financial, investment, trading, or other types of advice or recommendations supplied or endorsed by TradingView. Read more in the Terms of Use.