OPEN-SOURCE SCRIPT
Sri Yantra-Scret Geometry - AYNET
Explanation of the Script
Inputs:
periods: Number of bars used for calculating the moving average and standard deviation.
yloc: Chooses the display location (above or below the bars).
Moving Average and Standard Deviation:
ma: Moving average of the close price for the specified period.
std: Standard deviation, used to set the range for the Sri Yantra triangle points.
Triangle Points:
p1, p2, and p3 are the points for constructing the triangle, with p1 and p2 set at two standard deviations above and below the moving average, and p3 at the moving average itself.
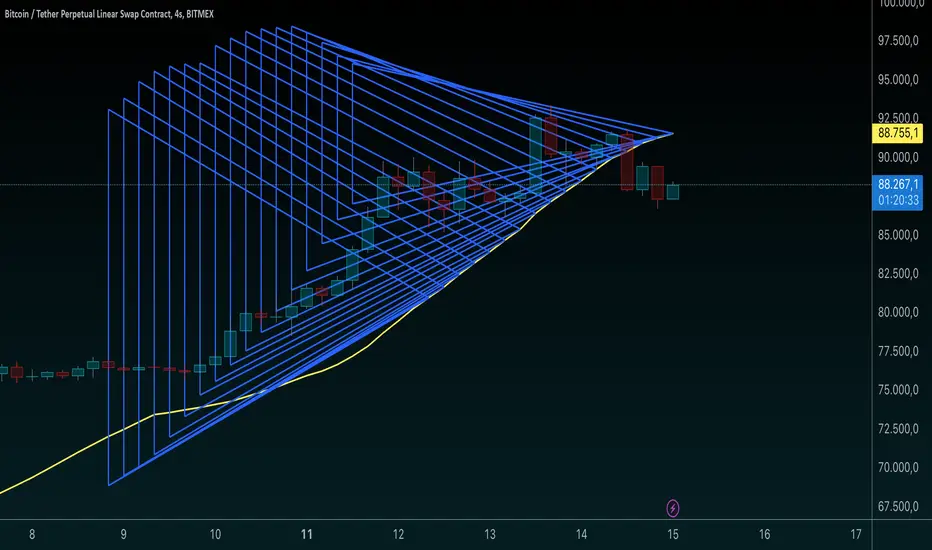
Sri Yantra Triangle Drawing:
Three lines form a triangle, with the moving average line serving as the midpoint anchor.
The triangle pattern shifts across bars as new moving average values are calculated.
Moving Average Plot:
The moving average is plotted in red for visual reference against the triangle pattern.
This basic script emulates the Sri Yantra pattern using price data, creating a spiritual and aesthetic overlay on price charts, ideal for users looking to incorporate sacred geometry into their technical analysis.
Inputs:
periods: Number of bars used for calculating the moving average and standard deviation.
yloc: Chooses the display location (above or below the bars).
Moving Average and Standard Deviation:
ma: Moving average of the close price for the specified period.
std: Standard deviation, used to set the range for the Sri Yantra triangle points.
Triangle Points:
p1, p2, and p3 are the points for constructing the triangle, with p1 and p2 set at two standard deviations above and below the moving average, and p3 at the moving average itself.
Sri Yantra Triangle Drawing:
Three lines form a triangle, with the moving average line serving as the midpoint anchor.
The triangle pattern shifts across bars as new moving average values are calculated.
Moving Average Plot:
The moving average is plotted in red for visual reference against the triangle pattern.
This basic script emulates the Sri Yantra pattern using price data, creating a spiritual and aesthetic overlay on price charts, ideal for users looking to incorporate sacred geometry into their technical analysis.
Open-source script
In true TradingView spirit, the creator of this script has made it open-source, so that traders can review and verify its functionality. Kudos to the author! While you can use it for free, remember that republishing the code is subject to our House Rules.
Disclaimer
The information and publications are not meant to be, and do not constitute, financial, investment, trading, or other types of advice or recommendations supplied or endorsed by TradingView. Read more in the Terms of Use.