OPEN-SOURCE SCRIPT
Directionality Oscillator
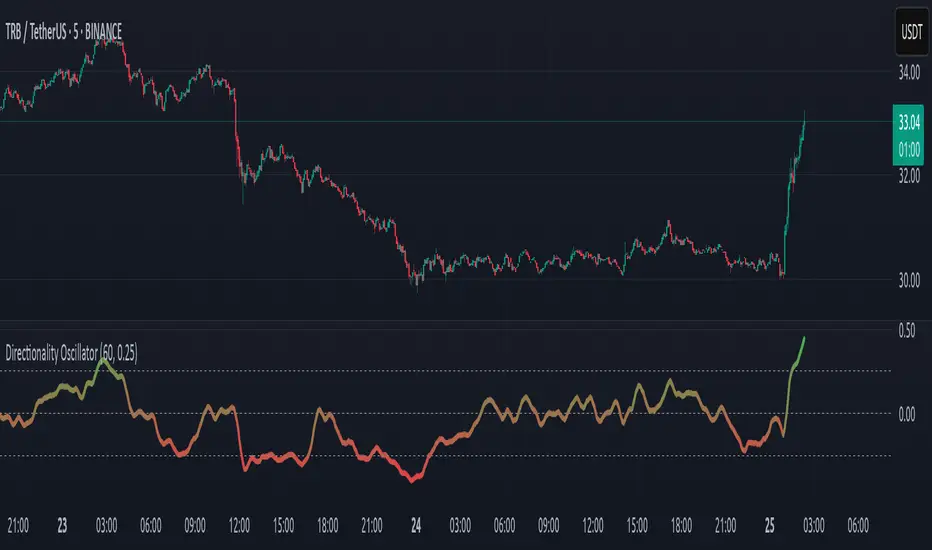
Directionality Oscillator is a simple momentum tool that measures net price displacement against total price activity over a chosen look-back period. It takes today’s closing price minus the close from “len” bars ago and divides that by the sum of all absolute bar-to-bar moves across the same span. The result is a value between –1 and +1, where positive values show that upward moves dominated and negative values show that downward moves prevailed.
To smooth out short-term noise, the indicator applies a five-bar simple moving average to the normalized value. A color gradient—from red at –1, through gray at 0, to green at +1—paints the line, making it easy to see whether bearish or bullish pressure is strongest. Two horizontal lines at the user-defined threshold and its negative mark zones of extreme directional strength. Readings above the positive threshold signal strong bullish momentum, and readings below the negative threshold signal strong bearish momentum.
Traders can watch for crossings above or below these threshold lines as trend confirmations or potential reversal warnings. A cross of the zero line indicates a shift in net directional control and can serve as an early trend-change alert when supported by price action or volume. Because it filters out sideways noise by normalizing against total activity, it highlights sustained directional thrust more clearly than a raw price-change measure.
Open-source script
In true TradingView spirit, the creator of this script has made it open-source, so that traders can review and verify its functionality. Kudos to the author! While you can use it for free, remember that republishing the code is subject to our House Rules.
Disclaimer
The information and publications are not meant to be, and do not constitute, financial, investment, trading, or other types of advice or recommendations supplied or endorsed by TradingView. Read more in the Terms of Use.