OPEN-SOURCE SCRIPT
Updated Real-time price distribution in candles
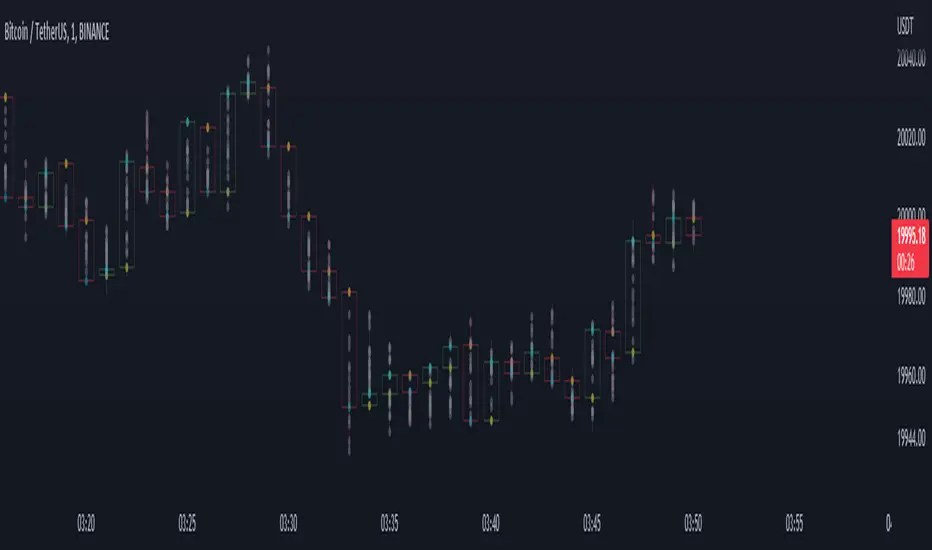
This indicator splits the candle time into 30 units to indicate where the price was at each time.
In the case of a 1-hour time zone, 60 minutes / 30 = 2 minutes, so this display the location of the price every 2 minutes.
In case of 1 minute time zone, it is displayed every 2 seconds.
CAUTION
If a transaction does not occur, the display may be omitted.
You can change the color of the opening and closing prices and the size of the dots.
Release Notes
Fix chart overlay codeOpen-source script
In true TradingView spirit, the creator of this script has made it open-source, so that traders can review and verify its functionality. Kudos to the author! While you can use it for free, remember that republishing the code is subject to our House Rules.
Disclaimer
The information and publications are not meant to be, and do not constitute, financial, investment, trading, or other types of advice or recommendations supplied or endorsed by TradingView. Read more in the Terms of Use.
Open-source script
In true TradingView spirit, the creator of this script has made it open-source, so that traders can review and verify its functionality. Kudos to the author! While you can use it for free, remember that republishing the code is subject to our House Rules.
Disclaimer
The information and publications are not meant to be, and do not constitute, financial, investment, trading, or other types of advice or recommendations supplied or endorsed by TradingView. Read more in the Terms of Use.