OPEN-SOURCE SCRIPT
Multi Time Frame (MTF) RSI
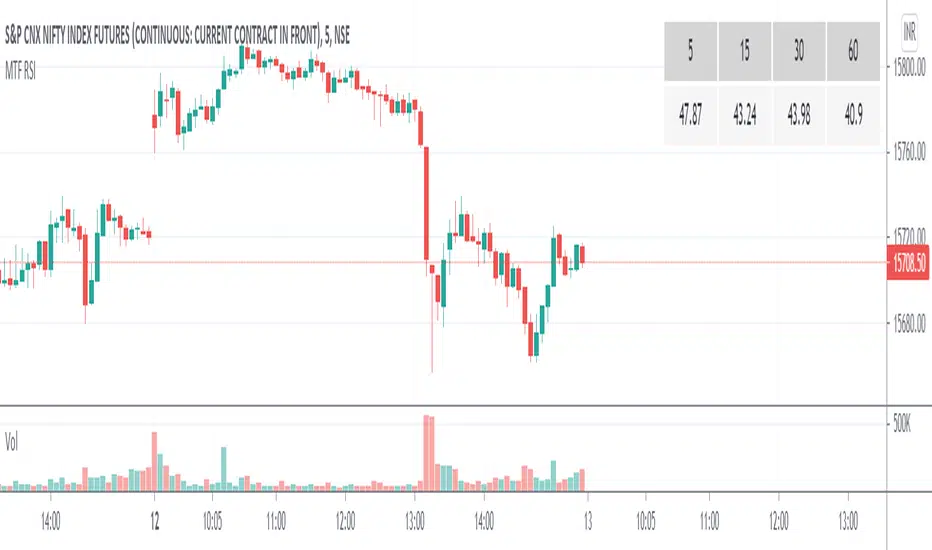
This script can display Multi time frame (MTF) Relative Strength Index (RSI) values. It works on any chart and appears at the top left of the screen.
1. It can plot values from 4 different time frames which can be customized.
2. Higher time frame indicates the main trend
3. Overbought and oversold levels are highlighted with different colours.
1. It can plot values from 4 different time frames which can be customized.
2. Higher time frame indicates the main trend
3. Overbought and oversold levels are highlighted with different colours.
Open-source script
In true TradingView spirit, the creator of this script has made it open-source, so that traders can review and verify its functionality. Kudos to the author! While you can use it for free, remember that republishing the code is subject to our House Rules.
Disclaimer
The information and publications are not meant to be, and do not constitute, financial, investment, trading, or other types of advice or recommendations supplied or endorsed by TradingView. Read more in the Terms of Use.