OPEN-SOURCE SCRIPT
PulseMA + MA
Description
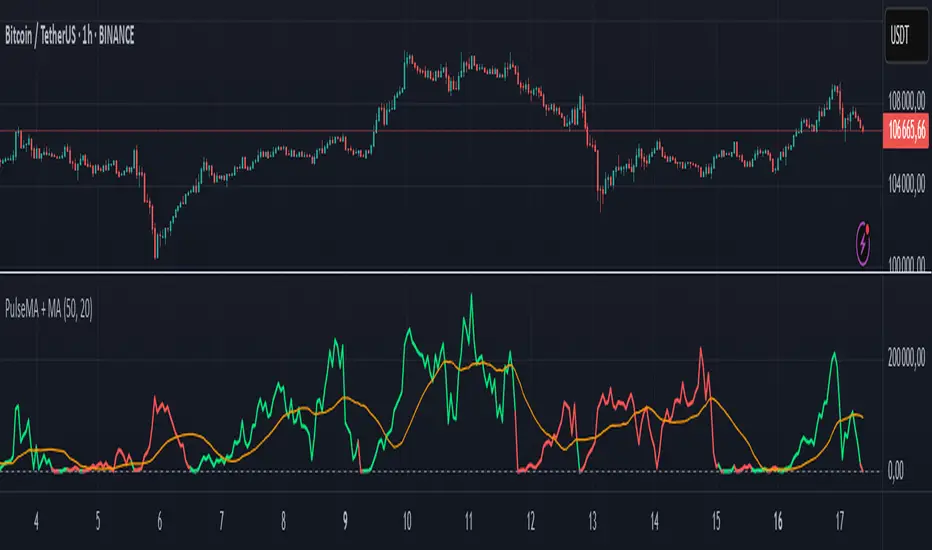
The PulseMA + MA indicator is an analytical tool that combines the analysis of the price relationship to a base Exponential Moving Average (EMA) with a smoothed Simple Moving Average (SMA) of this relationship. The indicator helps traders identify the direction and momentum of market trends and generates entry signals, displaying data as lines below the price chart.
Key Features
PulseMA: Calculates trend momentum by multiplying the number of consecutive candles above or below the base EMA by the slope of this average. The number of candles determines trend strength (positive for an uptrend, negative for a downtrend), while the EMA slope reflects the rate of change of the average. The PulseMA value is scaled by multiplying by 100.
Smoothed Average (PulseMA MA): Adds a smoothed SMA, facilitating the identification of long-term changes in market momentum.
Dynamic Colors: The PulseMA line changes color based on the price position relative to the base EMA (green for price above, red for price below).
Zero Line: Indicates the area where the price is close to the base EMA.
Applications
The PulseMA + MA indicator is designed for traders and technical analysts who aim to:
Analyze the direction and momentum of market trends, particularly with higher PulseMA Length values (e.g., 100), which provide a less sensitive EMA for longer-term trends.
Generate entry signals based on the PulseMA color change or the crossover of PulseMA with PulseMA MA.
Anticipate potential price reversals to the zero line when PulseMA is significantly distant from it, which may indicate market overextension.
How to Use
Add the Indicator to the Chart: Search for "PulseMA + MA" in the indicator library and add it to your chart.
Adjust Parameters:
PulseMA Length: Length of the base EMA (default: 50).
PulseMA Smoothing Length: Length of the smoothed SMA (default: 20).
Interpretation:
Green PulseMA Line: Price is above the base EMA, suggesting an uptrend.
Red PulseMA Line: Price is below the base EMA, indicating a downtrend.
PulseMA Color Change: May signal an entry point (recommended to wait for 2 candles to reduce noise).
PulseMA Crossing PulseMA MA from Below: May indicate a buy signal in an uptrend.
Zero Line: Indicates the area where the price is close to the base EMA.
Significant Deviation of PulseMA from the Zero Line: Suggests a potential price reversal to the zero line, indicating possible market overextension.
Notes
The indicator generates trend signals and can be used to independently identify entry points, e.g., on PulseMA color changes (waiting 2 candles is recommended to reduce noise) or when PulseMA crosses PulseMA MA from below.
In sideways markets, it is advisable to use the indicator with a volatility filter to limit false signals.
Adjusting the lengths of the averages to suit the specific instrument can improve signal accuracy.
Open-source script
In true TradingView spirit, the creator of this script has made it open-source, so that traders can review and verify its functionality. Kudos to the author! While you can use it for free, remember that republishing the code is subject to our House Rules.
Disclaimer
The information and publications are not meant to be, and do not constitute, financial, investment, trading, or other types of advice or recommendations supplied or endorsed by TradingView. Read more in the Terms of Use.