OPEN-SOURCE SCRIPT
Updated 3cf
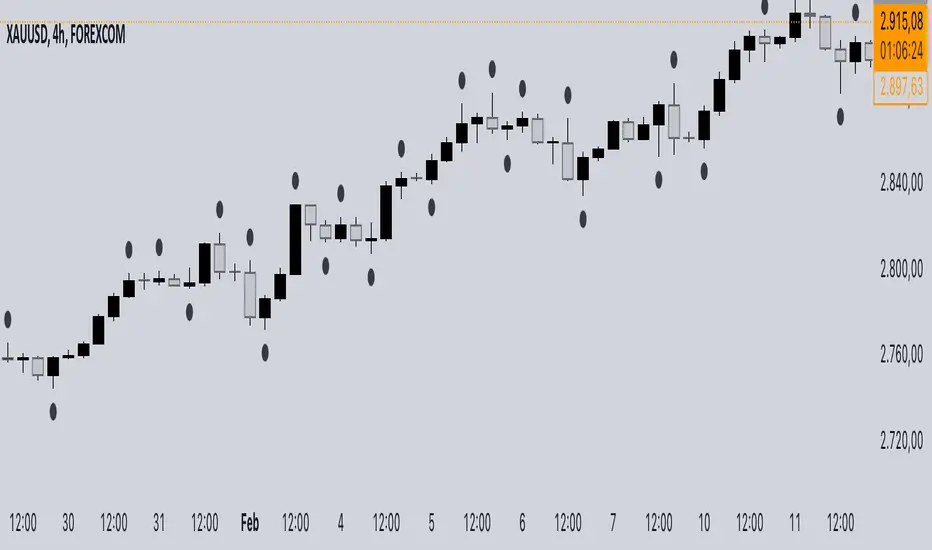
This indicator identifies and signals the points of swing highs and swing lows on the price chart using an algorithm based on market structure. Local highs and lows are highlighted with a colored dot, making it easier to perform technical analysis and recognize trend reversals.
The indicator analyzes a predefined number of bars (e.g., 5 candles) to determine relative highs and lows:
Swing High (Local High) → The current candle has a higher high compared to the previous and subsequent candle.
Swing Low (Local Low) → The current candle has a lower low compared to the previous and subsequent candle.
When a candle meets one of these conditions, a visual dot is placed to indicate the potential reversal point.
Release Notes
Added a toggle option to enable or disable the display of local highs and lows in the script. This is done using an input(true, title="Show max/min") checkbox, which allows users to control whether the plotted markers for highs and lows are shown. The plotshape functions are modified to check the enableDisplay variable, ensuring that the circles are only drawn when the option is enabled.Open-source script
In true TradingView spirit, the creator of this script has made it open-source, so that traders can review and verify its functionality. Kudos to the author! While you can use it for free, remember that republishing the code is subject to our House Rules.
Disclaimer
The information and publications are not meant to be, and do not constitute, financial, investment, trading, or other types of advice or recommendations supplied or endorsed by TradingView. Read more in the Terms of Use.
Open-source script
In true TradingView spirit, the creator of this script has made it open-source, so that traders can review and verify its functionality. Kudos to the author! While you can use it for free, remember that republishing the code is subject to our House Rules.
Disclaimer
The information and publications are not meant to be, and do not constitute, financial, investment, trading, or other types of advice or recommendations supplied or endorsed by TradingView. Read more in the Terms of Use.