OPEN-SOURCE SCRIPT
Updated HTF Overlay Candles (Aggregated)
🕯️ Synthetic Aggregated Candles
Created by: The_Forex_Steward
License: Mozilla Public License 2.0
🔍 Description
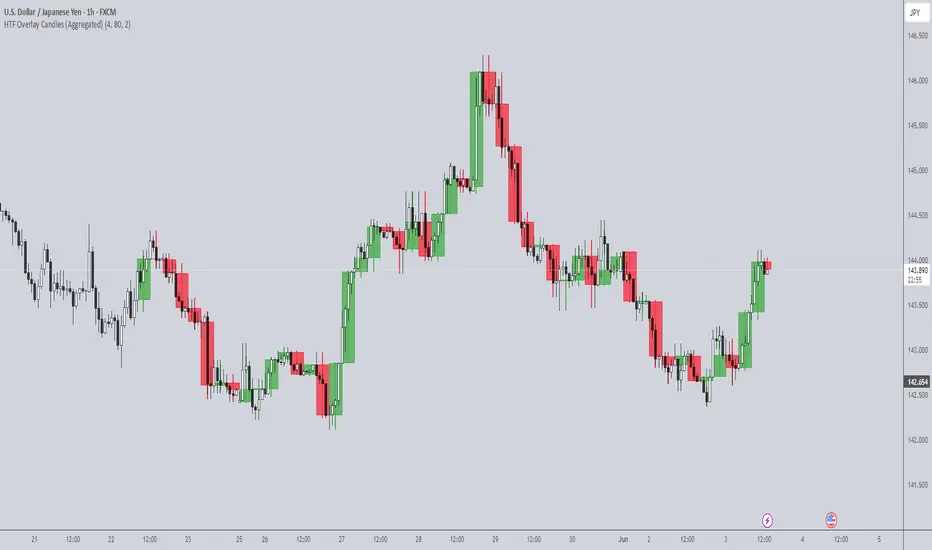
This indicator creates visually aggregated candles directly on your chart, allowing you to view synthetic candlesticks that combine multiple bars into one. It enables a higher-level perspective of price action without switching timeframes.
Each synthetic candle is built by combining a user-defined number of consecutive bars (e.g., 4 bars from the current timeframe form one aggregated candle). It accurately tracks open, high, low, and close values, then draws a colored box and wick to represent the aggregated data.
⚙️ Features
📌 Use Case
Ideal for traders looking to:
- Reduce noise in lower timeframes
- Visualize price action in broader chunks
- Spot larger structure and swing patterns without switching charts
📈 How It Works
At every bar, the script checks whether a new aggregation interval has begun (aligned to the day start). If so, it finalizes the previous candle and starts a new one. On the last bar of the chart, it ensures the final synthetic candle is drawn.
✅ Tip
For best results, apply this script on intraday timeframes and experiment with different aggregation factors (4, 6, 12, etc.) to discover the most insightful compression for your strategy.
Note: This script is optimized for visual representation only. It does not repaint, but it is not intended for algorithmic strategies or alerts.
Created by: The_Forex_Steward
License: Mozilla Public License 2.0
🔍 Description
This indicator creates visually aggregated candles directly on your chart, allowing you to view synthetic candlesticks that combine multiple bars into one. It enables a higher-level perspective of price action without switching timeframes.
Each synthetic candle is built by combining a user-defined number of consecutive bars (e.g., 4 bars from the current timeframe form one aggregated candle). It accurately tracks open, high, low, and close values, then draws a colored box and wick to represent the aggregated data.
⚙️ Features
- Aggregation Factor: Combine candles over a custom number of bars (e.g., 4 = 4x current TF)
- Timezone Alignment: Aggregation is aligned with midnight in UTC-5 (modifiable in code)
- Custom Colors: Choose colors for bullish and bearish synthetic candles
- Body Opacity: Control the opacity of the candle body for visual clarity
- Wick Width: Customize the thickness of the candle wick
📌 Use Case
Ideal for traders looking to:
- Reduce noise in lower timeframes
- Visualize price action in broader chunks
- Spot larger structure and swing patterns without switching charts
📈 How It Works
At every bar, the script checks whether a new aggregation interval has begun (aligned to the day start). If so, it finalizes the previous candle and starts a new one. On the last bar of the chart, it ensures the final synthetic candle is drawn.
✅ Tip
For best results, apply this script on intraday timeframes and experiment with different aggregation factors (4, 6, 12, etc.) to discover the most insightful compression for your strategy.
Note: This script is optimized for visual representation only. It does not repaint, but it is not intended for algorithmic strategies or alerts.
Release Notes
agg close logic updatedOpen-source script
In true TradingView spirit, the creator of this script has made it open-source, so that traders can review and verify its functionality. Kudos to the author! While you can use it for free, remember that republishing the code is subject to our House Rules.
Disclaimer
The information and publications are not meant to be, and do not constitute, financial, investment, trading, or other types of advice or recommendations supplied or endorsed by TradingView. Read more in the Terms of Use.
Open-source script
In true TradingView spirit, the creator of this script has made it open-source, so that traders can review and verify its functionality. Kudos to the author! While you can use it for free, remember that republishing the code is subject to our House Rules.
Disclaimer
The information and publications are not meant to be, and do not constitute, financial, investment, trading, or other types of advice or recommendations supplied or endorsed by TradingView. Read more in the Terms of Use.