OPEN-SOURCE SCRIPT
CKSD
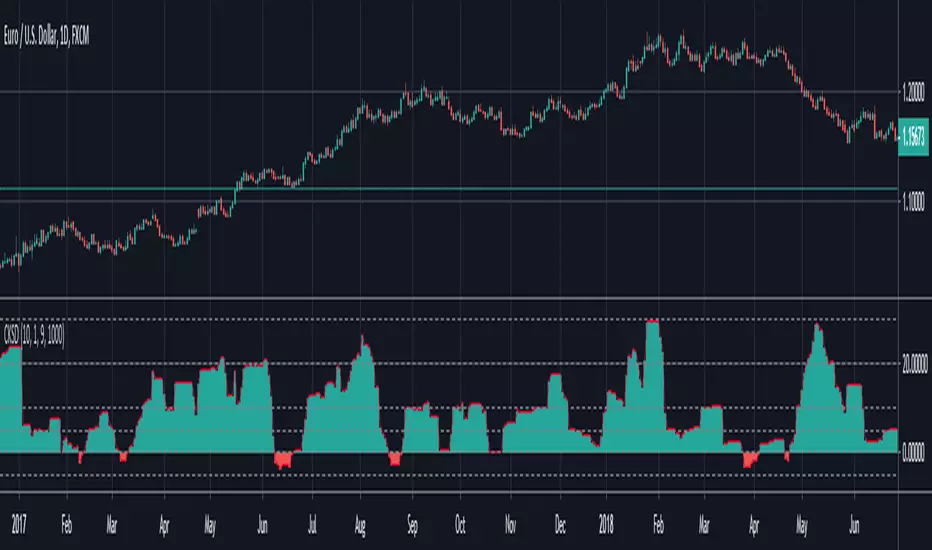
Hi. It's simply histogram that shows divergence between the lines of the Chande Kroll Stop ind (built-in TradingView ind). I noticed that the lines intersect or are very close to each other if the volatility decreases. You can use MA like the main line or just 5, 10 lines how I do. Sorry for code Im not a programmer
Open-source script
In true TradingView spirit, the creator of this script has made it open-source, so that traders can review and verify its functionality. Kudos to the author! While you can use it for free, remember that republishing the code is subject to our House Rules.
Disclaimer
The information and publications are not meant to be, and do not constitute, financial, investment, trading, or other types of advice or recommendations supplied or endorsed by TradingView. Read more in the Terms of Use.