OPEN-SOURCE SCRIPT
Updated Jigga - Heatmap Comparision
Hi All,
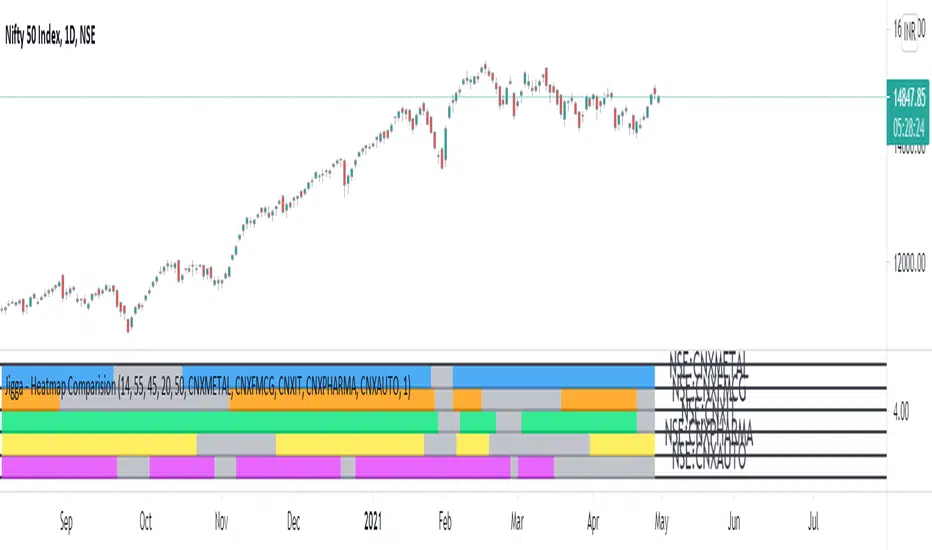
I always have a question on how to know which sector is performing. I have created this Heatmap comparison to know strength of sector.
I have used RSI and MACD calculation and put it across 5 different index. Color shows bullishness and Gray shows weakness.
You can select RSI or MACD or Both to have calculation. And you can also compare stocks if you want.
Note: Use it for Medium / Long term investment. Can not be use for Intraday.
Happy investing !!
Release Notes
Updated to version=5Open-source script
In true TradingView spirit, the creator of this script has made it open-source, so that traders can review and verify its functionality. Kudos to the author! While you can use it for free, remember that republishing the code is subject to our House Rules.
Disclaimer
The information and publications are not meant to be, and do not constitute, financial, investment, trading, or other types of advice or recommendations supplied or endorsed by TradingView. Read more in the Terms of Use.
Open-source script
In true TradingView spirit, the creator of this script has made it open-source, so that traders can review and verify its functionality. Kudos to the author! While you can use it for free, remember that republishing the code is subject to our House Rules.
Disclaimer
The information and publications are not meant to be, and do not constitute, financial, investment, trading, or other types of advice or recommendations supplied or endorsed by TradingView. Read more in the Terms of Use.