OPEN-SOURCE SCRIPT
Updated RSI Horizontal resistance levels
RSI Horizontal Resistance Levels
Purpose
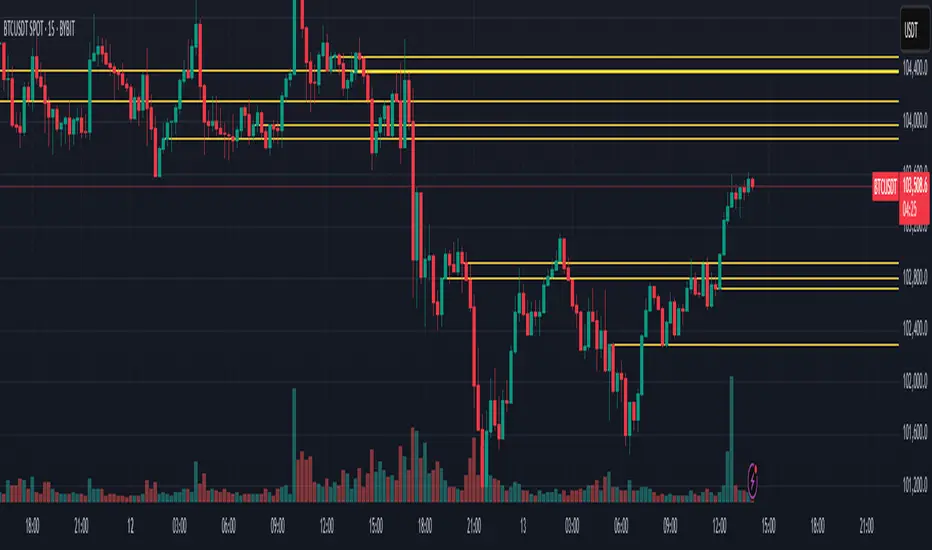
This study automatically draws horizontal price rays every time the Relative Strength Index (RSI) trades inside a user‑defined band (default = 50 ± 1). The idea is to spotlight price levels that historically coincided with a specific RSI state—levels that often evolve into short‑term support or resistance as sentiment repeats.
How it works
Raw RSI – The script computes an un‑smoothed RSI of the closing price (rsiLength, default = 3).
Trigger zone – Whenever RSI falls within level ± tolerance (e.g., 49 – 51) the close price of that bar becomes a reference.
Horizontal ray – A ray (extend.right) is drawn from that close and continues indefinitely to the right, creating a live price level.
History management – Only the most recent N rays are kept (maxRays, default = 5); the oldest line is deleted automatically to avoid chart clutter.
Inputs
Name Default Description
RSI Length 3 Look‑back of the RSI calculation.
RSI Level 50 Center of the trigger zone. Common alternatives: 30, 70, custom mid‑lines.
Tolerance 1 Width of the RSI band on each side of RSI Level (set 0 for an exact hit).
Max Rays 5 Maximum number of active horizontal levels kept on screen.
Ray Color Yellow Visual color of the rays.
Ray Width 2 Thickness of the rays.
How to use it
Spot recurring reaction zones – Markets often hesitate near prices where momentum has flipped before. The rays reveal those spots automatically.
Combine with candlestick or volume cues – A level marked by this script plus a rejection wick, volume spike, or divergence can strengthen conviction.
Adapt the band –
50 ± tolerance → momentum balance line (trend pullbacks)
70 ± tolerance → overbought fade levels
30 ± tolerance → oversold bounce levels
Works on any asset or timeframe; shorter RSI periods highlight intraday rotations, longer periods capture swing pivots.
Tips & cautions
A drawn line is not a guarantee of future reversal—always validate with price action and risk management.
For high‑frequency strategies, consider lowering tolerance or increasing rsiLength to reduce noise.
You can add custom alerts on RSI crossing the band to receive push or email notifications.
Happy trading!
Purpose
This study automatically draws horizontal price rays every time the Relative Strength Index (RSI) trades inside a user‑defined band (default = 50 ± 1). The idea is to spotlight price levels that historically coincided with a specific RSI state—levels that often evolve into short‑term support or resistance as sentiment repeats.
How it works
Raw RSI – The script computes an un‑smoothed RSI of the closing price (rsiLength, default = 3).
Trigger zone – Whenever RSI falls within level ± tolerance (e.g., 49 – 51) the close price of that bar becomes a reference.
Horizontal ray – A ray (extend.right) is drawn from that close and continues indefinitely to the right, creating a live price level.
History management – Only the most recent N rays are kept (maxRays, default = 5); the oldest line is deleted automatically to avoid chart clutter.
Inputs
Name Default Description
RSI Length 3 Look‑back of the RSI calculation.
RSI Level 50 Center of the trigger zone. Common alternatives: 30, 70, custom mid‑lines.
Tolerance 1 Width of the RSI band on each side of RSI Level (set 0 for an exact hit).
Max Rays 5 Maximum number of active horizontal levels kept on screen.
Ray Color Yellow Visual color of the rays.
Ray Width 2 Thickness of the rays.
How to use it
Spot recurring reaction zones – Markets often hesitate near prices where momentum has flipped before. The rays reveal those spots automatically.
Combine with candlestick or volume cues – A level marked by this script plus a rejection wick, volume spike, or divergence can strengthen conviction.
Adapt the band –
50 ± tolerance → momentum balance line (trend pullbacks)
70 ± tolerance → overbought fade levels
30 ± tolerance → oversold bounce levels
Works on any asset or timeframe; shorter RSI periods highlight intraday rotations, longer periods capture swing pivots.
Tips & cautions
A drawn line is not a guarantee of future reversal—always validate with price action and risk management.
For high‑frequency strategies, consider lowering tolerance or increasing rsiLength to reduce noise.
You can add custom alerts on RSI crossing the band to receive push or email notifications.
Happy trading!
Release Notes
Just updating screenshotOpen-source script
In true TradingView spirit, the creator of this script has made it open-source, so that traders can review and verify its functionality. Kudos to the author! While you can use it for free, remember that republishing the code is subject to our House Rules.
Disclaimer
The information and publications are not meant to be, and do not constitute, financial, investment, trading, or other types of advice or recommendations supplied or endorsed by TradingView. Read more in the Terms of Use.
Open-source script
In true TradingView spirit, the creator of this script has made it open-source, so that traders can review and verify its functionality. Kudos to the author! While you can use it for free, remember that republishing the code is subject to our House Rules.
Disclaimer
The information and publications are not meant to be, and do not constitute, financial, investment, trading, or other types of advice or recommendations supplied or endorsed by TradingView. Read more in the Terms of Use.