OPEN-SOURCE SCRIPT
Updated VOL & AVG Overlay
Custom Session Volume Versus Average Volume
Description:
This indicator will create an overlay on your chart that will show you the following information:
Options:
Example:
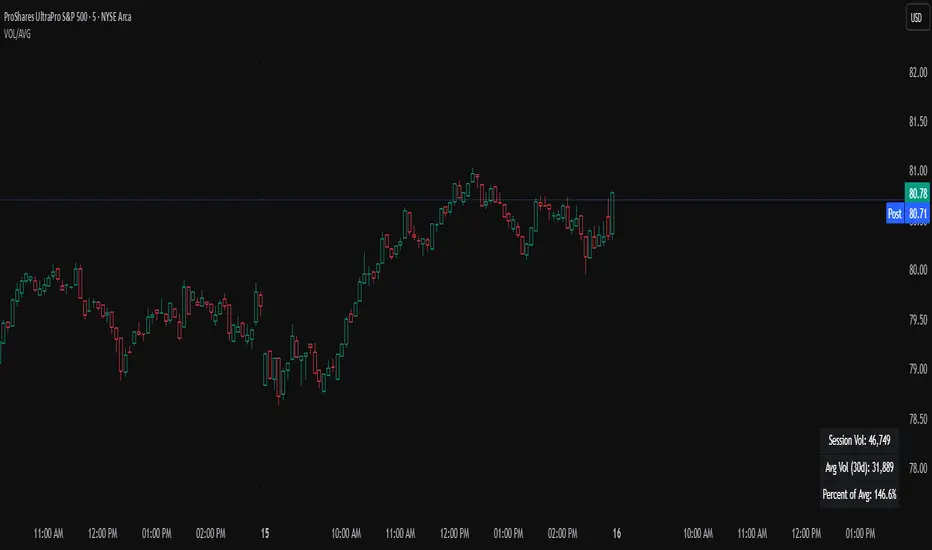
Set indicator to 30 period average. Set custom time frame to 9:30am to 10:30am Eastern/New York.
When the time frame for the calculation is closed, the indicator will provide a comparison of the current days volume compared to the average of 30 previous days for that same time frame and display it as a percentage in the table.
In this example you could compare how the first hour of the trading day compares to the previous 30 day's average, aiding in evaluating the potential volume for the remainder of the day.
Notes:
If you prefer data in this format as opposed to a plotted line, check out my other indicator: ADR & ATR Overlay
Description:
This indicator will create an overlay on your chart that will show you the following information:
- Custom Session Volume
- Average For Selected Session
- Percentage Comparison
Options:
- Set Custom Time Frame For Calculations
- Set Custom Time Frame For Average Comparison
- Set Custom Time Zone
- Enable / Disable Each Value
- Change Text Color
- Change Background Color
- Change Table location
Example:
Set indicator to 30 period average. Set custom time frame to 9:30am to 10:30am Eastern/New York.
When the time frame for the calculation is closed, the indicator will provide a comparison of the current days volume compared to the average of 30 previous days for that same time frame and display it as a percentage in the table.
In this example you could compare how the first hour of the trading day compares to the previous 30 day's average, aiding in evaluating the potential volume for the remainder of the day.
Notes:
- Times must be entered in 24 hour format. (1pm = 13:00 etc.)
- This indicator is for Intra-day time frames, not > Day.
If you prefer data in this format as opposed to a plotted line, check out my other indicator: ADR & ATR Overlay
Release Notes
updated chart example onlyRelease Notes
updating chart onlyRelease Notes
Added an additional (optional) top row to the table so values aren't covered by Trading Views buttons if placed in top right corner. Release Notes
corrected calculation logic when changing time frame on chartOpen-source script
In true TradingView spirit, the creator of this script has made it open-source, so that traders can review and verify its functionality. Kudos to the author! While you can use it for free, remember that republishing the code is subject to our House Rules.
Disclaimer
The information and publications are not meant to be, and do not constitute, financial, investment, trading, or other types of advice or recommendations supplied or endorsed by TradingView. Read more in the Terms of Use.
Open-source script
In true TradingView spirit, the creator of this script has made it open-source, so that traders can review and verify its functionality. Kudos to the author! While you can use it for free, remember that republishing the code is subject to our House Rules.
Disclaimer
The information and publications are not meant to be, and do not constitute, financial, investment, trading, or other types of advice or recommendations supplied or endorsed by TradingView. Read more in the Terms of Use.