OPEN-SOURCE SCRIPT
Updated IT-Dual Relative Strength
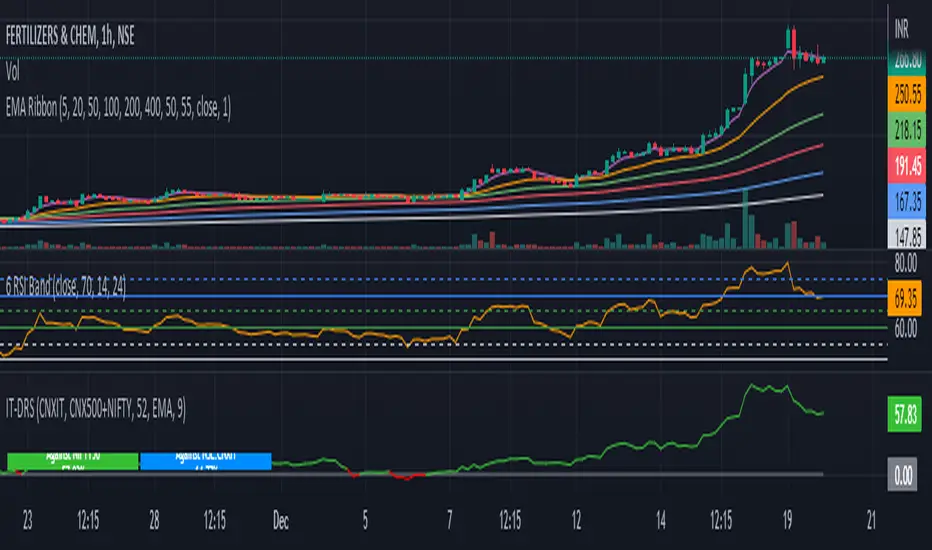
One can use this indicator to compare two security i.e. (Nifty and stock with its own sector) how it is performing in compare with preferred index ( Nifty 50 by default).
> 0 outperforming
< 0 underperforming
Works best for Daily TF, but can be applied to Weekly and monthly charts .
Can be use on smaller time frame as well, as per the number of hour you want to calculate.
Apply it to Nifty 50 , industry index, sector index or other security in similar sector
I have Added the Box table as well which shows the performance agents Nifty and selected sector.
Release Notes
This is the upgraded version for IT-Dual Relative Strength with same name but V2.0One can use this indicator to compare two security i.e. ( Nifty and stock with its own sector) how it is performing in compare with preferred index ( Nifty 50 by default).
> 0 outperforming
< 0 underperforming
Works best for Daily TF, but can be applied to Weekly and monthly charts .
Can be use on smaller time frame as well, as per the number of hour you want to calculate.
Apply it to Nifty 50 , industry index, sector index or other security in similar sector
I have Added the Box table as well which shows the performance agents Nifty and selected sector.
Release Notes:
Added toggle color option on crossovers
Fixed bug on label display, even when plot option was disabled
Release Notes
In addition to the existing RS behavior, it is now possible to superimpose price-action behavior on the RS line.As per existing RS, RS above zero indicates outperformance/strength over the selected benchmark and RS below zero indicates underperformance/weakness over the selected benchmark for the selected period.
Added length of SMA/EMA for RS is 9
Open-source script
In true TradingView spirit, the creator of this script has made it open-source, so that traders can review and verify its functionality. Kudos to the author! While you can use it for free, remember that republishing the code is subject to our House Rules.
Disclaimer
The information and publications are not meant to be, and do not constitute, financial, investment, trading, or other types of advice or recommendations supplied or endorsed by TradingView. Read more in the Terms of Use.