OPEN-SOURCE SCRIPT
Recession Warning Model [BackQuant]
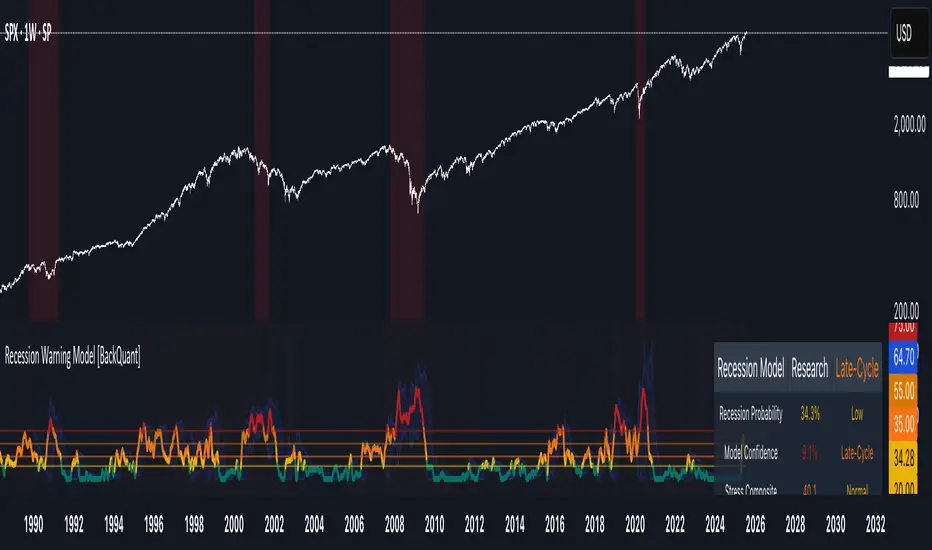
Recession Warning Model [BackQuant]
Overview
The Recession Warning Model (RWM) is a Pine Script® indicator designed to estimate the probability of an economic recession by integrating multiple macroeconomic, market sentiment, and labor market indicators. It combines over a dozen data series into a transparent, adaptive, and actionable tool for traders, portfolio managers, and researchers. The model provides customizable complexity levels, display modes, and data processing options to accommodate various analytical requirements while ensuring robustness through dynamic weighting and regime-aware adjustments.
Purpose
The RWM fulfills the need for a concise yet comprehensive tool to monitor recession risk. Unlike approaches relying on a single metric, such as yield-curve inversion, or extensive economic reports, it consolidates multiple data sources into a single probability output. The model identifies active indicators, their confidence levels, and the current economic regime, enabling users to anticipate downturns and adjust strategies accordingly.
Core Features
- Indicator Families: Incorporates 13 indicators across five categories: Yield, Labor, Sentiment, Production, and Financial Stress.
- Dynamic Weighting: Adjusts indicator weights based on recent predictive accuracy, constrained within user-defined boundaries.
- Leading and Coincident Split: Separates early-warning (leading) and confirmatory (coincident) signals, with adjustable weighting (default 60/40 mix).
- Economic Regime Sensitivity: Modulates output sensitivity based on market conditions (Expansion, Late-Cycle, Stress, Crisis), using a composite of VIX, yield-curve, financial conditions, and credit spreads.
- Display Options: Supports four modes—Probability (0-100%), Binary (four risk bins), Lead/Coincident, and Ensemble (blended probability).
- Confidence Intervals: Reflects model stability, widening during high volatility or conflicting signals.
- Alerts: Configurable thresholds (Watch, Caution, Warning, Alert) with persistence filters to minimize false signals.
- Data Export: Enables CSV output for probabilities, signals, and regimes, facilitating external analysis in Python or R.
Model Complexity Levels
Users can select from four tiers to balance simplicity and depth:
1. Essential: Focuses on three core indicators—yield-curve spread, jobless claims, and unemployment change—for minimalistic monitoring.
2. Standard: Expands to nine indicators, adding consumer confidence, PMI, VIX, S&P 500 trend, money supply vs. GDP, and the Sahm Rule.
3. Professional: Includes all 13 indicators, incorporating financial conditions, credit spreads, JOLTS vacancies, and wage growth.
4. Research: Unlocks all indicators plus experimental settings for advanced users.
Key Indicators
Below is a summary of the 13 indicators, their data sources, and economic significance:
- Yield-Curve Spread: Difference between 10-year and 3-month Treasury yields. Negative spreads signal banking sector stress.
- Jobless Claims: Four-week moving average of unemployment claims. Sustained increases indicate rising layoffs.
- Unemployment Change: Three-month change in unemployment rate. Sharp rises often precede recessions.
- Sahm Rule: Triggers when unemployment rises 0.5% above its 12-month low, a reliable recession indicator.
- Consumer Confidence: University of Michigan survey. Declines reflect household pessimism, impacting spending.
- PMI: Purchasing Managers’ Index. Values below 50 indicate manufacturing contraction.
- VIX: CBOE Volatility Index. Elevated levels suggest market anticipation of economic distress.
- S&P 500 Growth: Weekly moving average trend. Declines reduce wealth effects, curbing consumption.
- M2 + GDP Trend: Monitors money supply and real GDP. Simultaneous declines signal credit contraction.
- NFCI: Chicago Fed’s National Financial Conditions Index. Positive values indicate tighter conditions.
- Credit Spreads: Proxy for corporate bond spreads using 10-year vs. 2-year Treasury yields. Widening spreads reflect stress.
- JOLTS Vacancies: Job openings data. Significant drops precede hiring slowdowns.
- Wage Growth: Year-over-year change in average hourly earnings. Late-cycle spikes often signal economic overheating.
Data Processing
- Rate of Change (ROC): Optionally applied to capture momentum in data series (default: 21-bar period).
- Z-Score Normalization: Standardizes indicators to a common scale (default: 252-bar lookback).
- Smoothing: Applies a short moving average to final signals (default: 5-bar period) to reduce noise.
- Binary Signals: Generated for each indicator (e.g., yield-curve inverted or PMI below 50) based on thresholds or Z-score deviations.
Probability Calculation
1. Each indicator’s binary signal is weighted according to user settings or dynamic performance.
2. Weights are normalized to sum to 100% across active indicators.
3. Leading and coincident signals are aggregated separately (if split mode is enabled) and combined using the specified mix.
4. The probability is adjusted by a regime multiplier, amplifying risk during Stress or Crisis regimes.
5. Optional smoothing ensures stable outputs.
Display and Visualization
- Probability Mode: Plots a continuous 0-100% recession probability with color gradients and confidence bands.
- Binary Mode: Categorizes risk into four levels (Minimal, Watch, Caution, Alert) for simplified dashboards.
- Lead/Coincident Mode: Displays leading and coincident probabilities separately to track signal divergence.
- Ensemble Mode: Averages traditional and split probabilities for a balanced view.
- Regime Background: Color-coded overlays (green for Expansion, orange for Late-Cycle, amber for Stress, red for Crisis).
- Analytics Table: Optional dashboard showing probability, confidence, regime, and top indicator statuses.
Practical Applications
- Asset Allocation: Adjust equity or bond exposures based on sustained probability increases.
- Risk Management: Hedge portfolios with VIX futures or options during regime shifts to Stress or Crisis.
- Sector Rotation: Shift toward defensive sectors when coincident signals rise above 50%.
- Trading Filters: Disable short-term strategies during high-risk regimes.
- Event Timing: Scale positions ahead of high-impact data releases when probability and VIX are elevated.
Configuration Guidelines
- Enable ROC and Z-score for consistent indicator comparison unless raw data is preferred.
- Use dynamic weighting with at least one economic cycle of data for optimal performance.
- Monitor stress composite scores above 80 alongside probabilities above 70 for critical risk signals.
- Adjust adaptation speed (default: 0.1) to 0.2 during Crisis regimes for faster indicator prioritization.
- Combine RWM with complementary tools (e.g., liquidity metrics) for intraday or short-term trading.
Limitations
- Macro indicators lag intraday market moves, making RWM better suited for strategic rather than tactical trading.
- Historical data availability may constrain dynamic weighting on shorter timeframes.
- Model accuracy depends on the quality and timeliness of economic data feeds.
Final Note
The Recession Warning Model provides a disciplined framework for monitoring economic downturn risks. By integrating diverse indicators with transparent weighting and regime-aware adjustments, it empowers users to make informed decisions in portfolio management, risk hedging, or macroeconomic research. Regular review of model outputs alongside market-specific tools ensures its effective application across varying market conditions.
Open-source script
In true TradingView spirit, the creator of this script has made it open-source, so that traders can review and verify its functionality. Kudos to the author! While you can use it for free, remember that republishing the code is subject to our House Rules.
Check out whop.com/backquant for Access to Invite Only Scripts!
Disclaimer
The information and publications are not meant to be, and do not constitute, financial, investment, trading, or other types of advice or recommendations supplied or endorsed by TradingView. Read more in the Terms of Use.