OPEN-SOURCE SCRIPT
JHW Volume Based Buy and Sell Momentum
The JHW Volume-Based Buy and Sell Momentum indicator is a custom momentum oscillator designed to capture market sentiment based on volume dynamics and price rate of change (ROC). It aims to identify bullish or bearish momentum by analyzing how price reacts to increasing or decreasing trading volume.
Core Logic:
The indicator calculates the Rate of Change (ROC) of the closing price.
It then accumulates this ROC separately based on whether the current volume is lower or higher than the previous bar:
If volume decreases, the ROC is added to a "negative volume index" accumulator.
If volume increases, the ROC is added to a "positive volume index" accumulator.
These two accumulators are combined to form a net momentum line.
Smoothing:
A Simple Moving Average (SMA) is applied to both accumulators over a user-defined period (default: 25 bars).
The sum of these smoothed values forms the signal line.
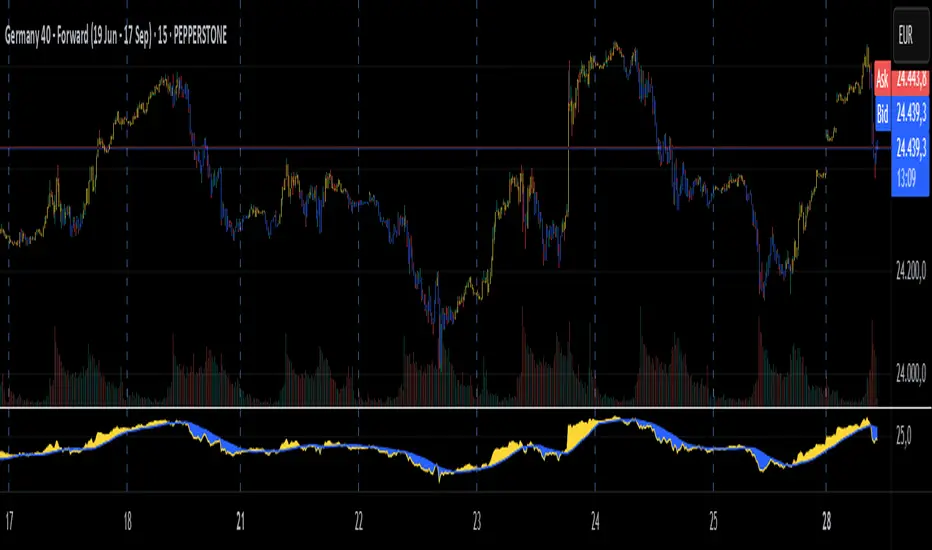
Visualization:
The indicator plots:
The net momentum line (yellow).
The smoothed signal line (blue).
The area between the two lines is filled with color:
Yellow when momentum is above the signal (bullish).
Blue when momentum is below the signal (bearish).
Bar colors are also adjusted to reflect the current momentum state.
Use Case:
This indicator helps traders:
Detect volume-driven momentum shifts.
Identify potential buy or sell zones based on volume behavior.
Confirm trends or spot early reversals.
Core Logic:
The indicator calculates the Rate of Change (ROC) of the closing price.
It then accumulates this ROC separately based on whether the current volume is lower or higher than the previous bar:
If volume decreases, the ROC is added to a "negative volume index" accumulator.
If volume increases, the ROC is added to a "positive volume index" accumulator.
These two accumulators are combined to form a net momentum line.
Smoothing:
A Simple Moving Average (SMA) is applied to both accumulators over a user-defined period (default: 25 bars).
The sum of these smoothed values forms the signal line.
Visualization:
The indicator plots:
The net momentum line (yellow).
The smoothed signal line (blue).
The area between the two lines is filled with color:
Yellow when momentum is above the signal (bullish).
Blue when momentum is below the signal (bearish).
Bar colors are also adjusted to reflect the current momentum state.
Use Case:
This indicator helps traders:
Detect volume-driven momentum shifts.
Identify potential buy or sell zones based on volume behavior.
Confirm trends or spot early reversals.
Open-source script
In true TradingView spirit, the creator of this script has made it open-source, so that traders can review and verify its functionality. Kudos to the author! While you can use it for free, remember that republishing the code is subject to our House Rules.
Disclaimer
The information and publications are not meant to be, and do not constitute, financial, investment, trading, or other types of advice or recommendations supplied or endorsed by TradingView. Read more in the Terms of Use.