OPEN-SOURCE SCRIPT
Updated ADR & ATR Extension from EMA
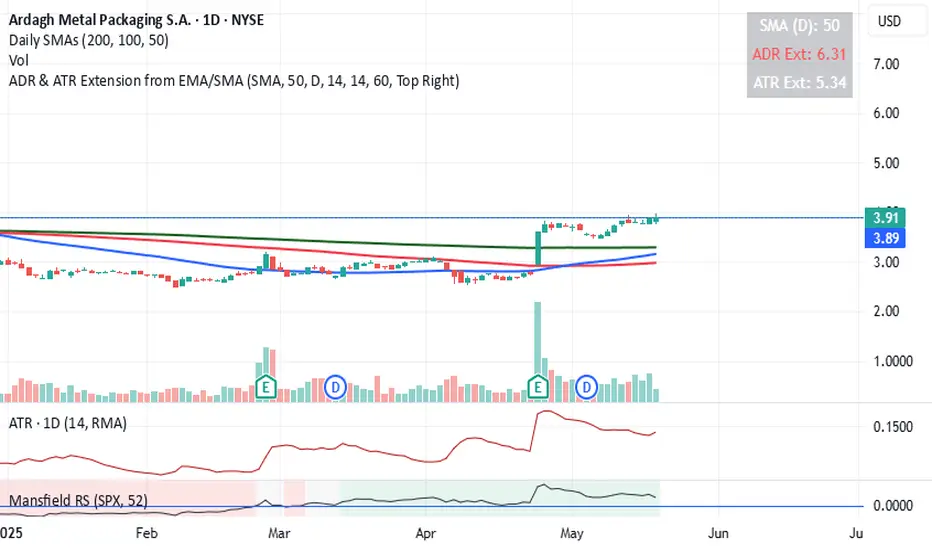
This indicator helps identify how extended the current price is from a chosen Exponential Moving Average (EMA) in terms of both Average Daily Range (ADR) and Average True Range (ATR).
It calculates:
ADR Extension = (Price - EMA) / ADR
ATR Extension = (Price - EMA) / ATR
The results are shown in a floating table on the chart.
The ADR line turns red if the price is more than 4 ADRs above the selected EMA
Customization Options:
- Select EMA length
- Choose between close or high as price input
- Set ADR and ATR periods
- Customize the label’s position, color, and transparency
- Use the chart's timeframe or a fixed timeframe
Release Notes
This indicator helps identify how extended the current price is from a chosen Moving Average (EMA or SMA) in terms of both Average Daily Range (ADR) and Average True Range (ATR).It calculates:
ADR Extension = (Price - EMA) / ADR
ATR Extension = (Price - EMA) / ATR
The results are shown in a floating table on the chart.
The ADR line turns red if the price is more than 4 ADRs above the selected EMA
Customization Options:
- Select between Exponential and Simple moving average
- Select MA length
- Choose between close or high as price input
- Set ADR and ATR periods
- Customize the label’s position, color, and transparency
- Use the chart's timeframe or a fixed timeframe
Release Notes
- Bug fixOpen-source script
In true TradingView spirit, the creator of this script has made it open-source, so that traders can review and verify its functionality. Kudos to the author! While you can use it for free, remember that republishing the code is subject to our House Rules.
Disclaimer
The information and publications are not meant to be, and do not constitute, financial, investment, trading, or other types of advice or recommendations supplied or endorsed by TradingView. Read more in the Terms of Use.
Open-source script
In true TradingView spirit, the creator of this script has made it open-source, so that traders can review and verify its functionality. Kudos to the author! While you can use it for free, remember that republishing the code is subject to our House Rules.
Disclaimer
The information and publications are not meant to be, and do not constitute, financial, investment, trading, or other types of advice or recommendations supplied or endorsed by TradingView. Read more in the Terms of Use.