OPEN-SOURCE SCRIPT
Updated Standard Deviation Oscillator
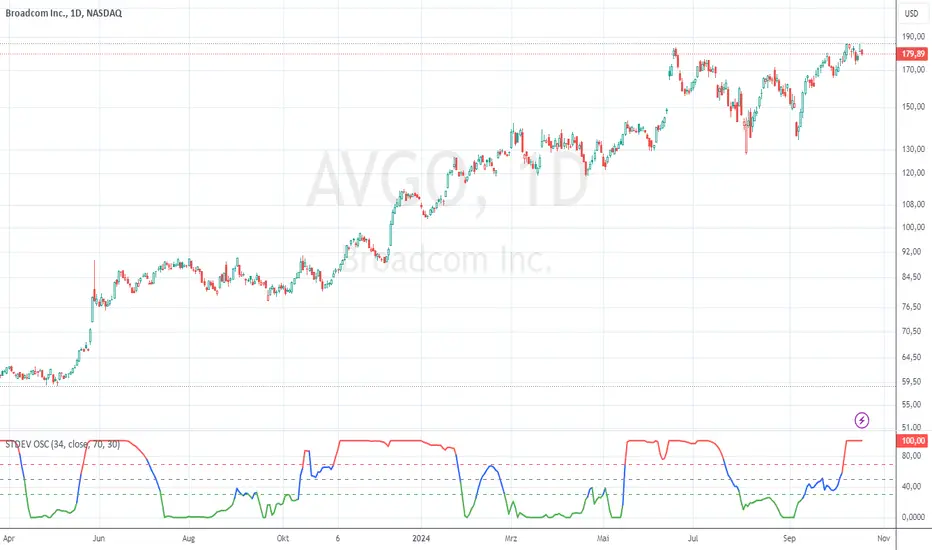
Standard Deviation Oscillator (STDEV OSC) v1.1
Description
The Standard Deviation Oscillator transforms traditional volatility measurements into a dynamic oscillator that fluctuates between 0 and 100. This advanced technical analysis tool helps traders identify periods of extreme volatility and potential market turning points.
Features
Indicator Parameters
Length: 20; Calculation period for standard deviation
Source: close; Price source for calculations
Overbought Level: 70; Upper threshold for high volatility
Oversold Level: 30; Lower threshold for low volatility
Visual Components
- Main Oscillator Line: Changes color based on current level
- Red: Above overbought level
- Green: Below oversold level
- Blue: Normal range
- Reference Lines:
- Overbought level (default: 70)
- Oversold level (default: 30)
- Middle line (50)
Alert Conditions
1. Volatility High Alert
- Triggers when oscillator crosses above the overbought level
- Useful for identifying potential market tops or breakout scenarios
2. Volatility Low Alert
- Triggers when oscillator crosses below the oversold level
- Helps identify potential market bottoms or consolidation periods
Risk Adjustment Tool
- Scale position sizes inversely to oscillator readings
- Reduce exposure during extremely high volatility periods
- Increase position sizes during normal volatility conditions
Best Practices
1. Timeframe Selection
- Best suited for 1H, 4H, and Daily charts
- Adjust length parameter based on timeframe
2. Confirmation
- Use in conjunction with trend indicators
- Confirm signals with price action patterns
- Consider overall market context
3. Parameter Optimization
- Backtest different length settings
- Adjust overbought/oversold levels based on asset
- Consider market conditions when setting alerts
Technical Notes
- Built in PineScript v5
- Optimized for TradingView platform
- Uses rolling window calculations for better adaptability
- Compatible with all trading instruments
- Minimal performance impact on charts
Version History
- v1.1: Added dynamic coloring, customizable levels, and alert conditions
- v1.0: Initial release with basic oscillator functionality
Disclaimer
This technical indicator is provided for educational and informational purposes only. Past performance is not indicative of future results. Always conduct thorough testing and use proper risk management techniques.
---
Tags: #TechnicalAnalysis #Volatility #Trading #Oscillator #TradingView #PineScript
Description
The Standard Deviation Oscillator transforms traditional volatility measurements into a dynamic oscillator that fluctuates between 0 and 100. This advanced technical analysis tool helps traders identify periods of extreme volatility and potential market turning points.
Features
- Normalized volatility readings (0-100 scale)
- Dynamic color changes based on volatility levels
- Customizable overbought/oversold thresholds
- Built-in alert conditions
- Adaptive calculation using rolling windows
- Clean, professional visualization
Indicator Parameters
Length: 20; Calculation period for standard deviation
Source: close; Price source for calculations
Overbought Level: 70; Upper threshold for high volatility
Oversold Level: 30; Lower threshold for low volatility
Visual Components
- Main Oscillator Line: Changes color based on current level
- Red: Above overbought level
- Green: Below oversold level
- Blue: Normal range
- Reference Lines:
- Overbought level (default: 70)
- Oversold level (default: 30)
- Middle line (50)
Alert Conditions
1. Volatility High Alert
- Triggers when oscillator crosses above the overbought level
- Useful for identifying potential market tops or breakout scenarios
2. Volatility Low Alert
- Triggers when oscillator crosses below the oversold level
- Helps identify potential market bottoms or consolidation periods
Risk Adjustment Tool
- Scale position sizes inversely to oscillator readings
- Reduce exposure during extremely high volatility periods
- Increase position sizes during normal volatility conditions
Best Practices
1. Timeframe Selection
- Best suited for 1H, 4H, and Daily charts
- Adjust length parameter based on timeframe
2. Confirmation
- Use in conjunction with trend indicators
- Confirm signals with price action patterns
- Consider overall market context
3. Parameter Optimization
- Backtest different length settings
- Adjust overbought/oversold levels based on asset
- Consider market conditions when setting alerts
Technical Notes
- Built in PineScript v5
- Optimized for TradingView platform
- Uses rolling window calculations for better adaptability
- Compatible with all trading instruments
- Minimal performance impact on charts
Version History
- v1.1: Added dynamic coloring, customizable levels, and alert conditions
- v1.0: Initial release with basic oscillator functionality
Disclaimer
This technical indicator is provided for educational and informational purposes only. Past performance is not indicative of future results. Always conduct thorough testing and use proper risk management techniques.
---
Tags: #TechnicalAnalysis #Volatility #Trading #Oscillator #TradingView #PineScript
Release Notes
Updated Screenshot and added script name according to House Rules on Script Publishing.Open-source script
In true TradingView spirit, the creator of this script has made it open-source, so that traders can review and verify its functionality. Kudos to the author! While you can use it for free, remember that republishing the code is subject to our House Rules.
Disclaimer
The information and publications are not meant to be, and do not constitute, financial, investment, trading, or other types of advice or recommendations supplied or endorsed by TradingView. Read more in the Terms of Use.
Open-source script
In true TradingView spirit, the creator of this script has made it open-source, so that traders can review and verify its functionality. Kudos to the author! While you can use it for free, remember that republishing the code is subject to our House Rules.
Disclaimer
The information and publications are not meant to be, and do not constitute, financial, investment, trading, or other types of advice or recommendations supplied or endorsed by TradingView. Read more in the Terms of Use.